“With inflation still well above the Committee’s longer-run goal and the labor market remaining tight, most participants continued to see significant upside risks to inflation, which could require further tightening of monetary policy.” That was the message following the release of the Federal Reserve’s (Fed) July meeting minutes.
It was that same July meeting which saw the Federal Open Market Committee (FOMC) raise the Fed Funds rate by 25 basis points (bps) to a range of 5.25%-5.50%. That marked the 11th time since March 2022 that the FOMC increased interest rates (from 0.00%), and a meeting in which almost all of the participants, which includes non- voting members, were in favor of the rate increase.
Since that meeting, other macro events such as the Fitch downgrade of U.S. debt and the rising supply of Treasuries have pushed yields to cycle highs, with 2-year and 10-year Treasury yields breaching prior support levels at 5% and 4.25%, respectively.
So, what happens next? The Fed provided some guidance from the annual Jackson Hole Economic Symposium (this year’s Symposium was titled “Structural Shifts in the Global Economy”). While no policy decisions are made at Jackson Hole, it remains a platform for several FOMC members – particularly Fed Chair Jerome Powell – to convey the Fed’s latest thoughts to the market.
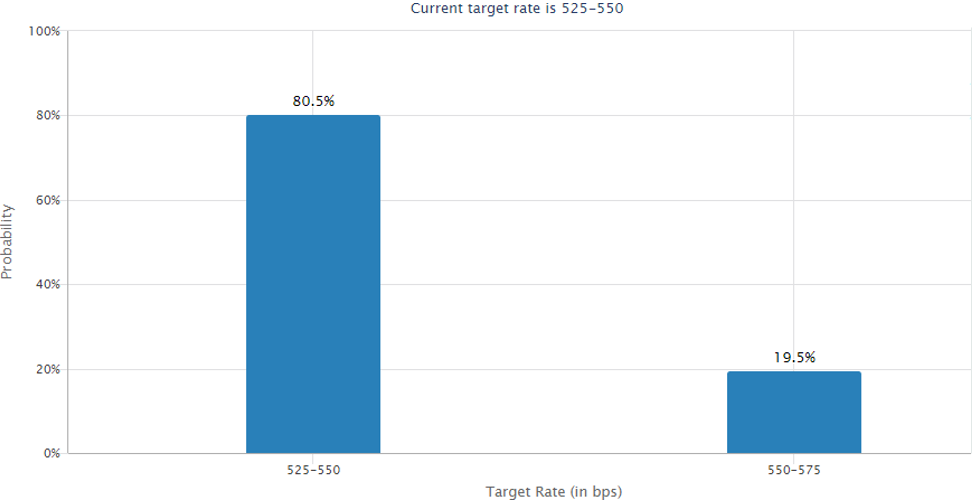
Powell's August 25 remarks reiterated his sentiments from the 2022 symposium, namely that the Fed remains intent on their goal of lowering inflation to 2%. Powell indicated that the Fed would be prepared to hike further “if” appropriate, but could afford to “proceed carefully.” Shortly following his comments, the market-implied probability of Fed action at its September 20 meeting shifted to 80.5% targeting no action, as detailed in the following chart.
The Inverted Yield Curve
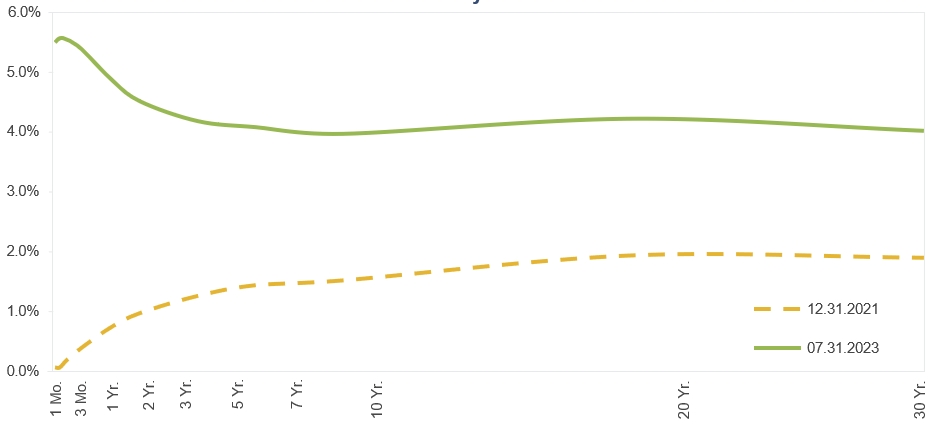
Let’s not forget about the yield curve, which has been inverted since March 2022. The curve is notably different than a few years ago, as illustrated below, which compares the shape and overall level of yields at year-end 2021 versus July 2023.
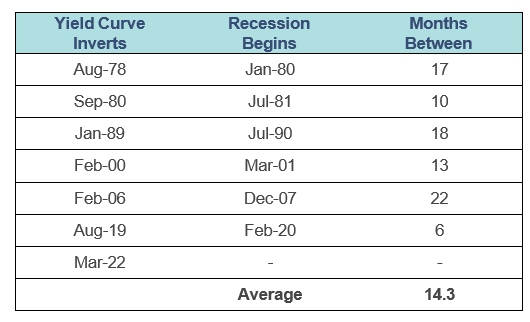
The inverted curve, which can be defined as the difference between yields on 2-year and 10-year Treasuries (known as the 2-10 spread) has historically been a reliable predictor for upcoming recessions. In fact, since 1978, there have been six dated recessions by National Bureau of Economic Research and, on average, the yield curve inverted about 14 months before the recession occurred. The table below details the time elapsed between the yield curve inversion and the start of the ensuing recession.
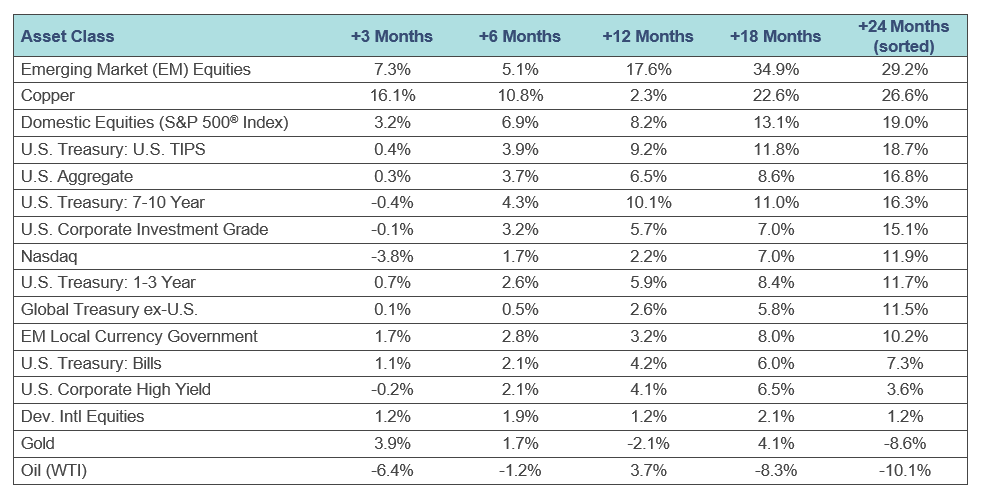
The yield curve has inverted: what comes next? Will a recession occur? When might it occur? The short answer: we do not know, but in terms of market performance, we can use history as a guide, using those same inversion dates listed in the table on the previous page to dissect performance for a variety of asset classes in the succeeding 3, 6, 12, 18 and 24 months.
From a historical perspective, emerging market (EM) equities, as measured by the MSCI EM Index, have proven to be the best performers, while Oil (WTI) has been the worst performer. Only Oil and Gold have produced negative returns in the 24-months following an inversion, while EM Equities and Copper are the only two sectors that have returned more than 20%.
Advisory Solutions Portfolio Implications
When setting an asset allocation framework, the Advisory Solutions team employs both a Strategic Allocation and a Tactical Allocation. In terms of Strategic Allocation, we employ a long-term (20-year) investment horizon with a primary focus on aligning the expected return and risk of the portfolio using proprietary capital market assumptions.
Our Tactical Asset Allocation positioning focuses on the next 12 months and applies our quantitative analytics to exploit market opportunities, including the shape of the yield curve. Notably, the shape of the curve is only one of dozens of factors that drive our analytics but it is a key indicator, in our view.
We believe investors should continue taking a long-term focus, allowing active management within the asset allocation to seek alpha. In our view, maintaining a disciplined approach is imperative, allowing the opportunity to navigate market volatility using a risk-focused approach in an effort to seek above-market returns with below- market volatility.
About the Author

Shane Burke, Executive Director, joined SCM in 2013 and has investment experience since 2002. Shane is a Portfolio Manager on SCM's Advisory Solutions team with a focus on fixed income. Prior to joining SCM, he worked as a senior analyst at New England Pension Consultants (NEPC) and as a portfolio accountant with State Street Corporation. Shane received his B.S. in Finance from the University of North Carolina at Wilmington and his M.B.A. from San Francisco - Golden Gate University.
Related Insights
05.07.2025 • Charles Wittmann, CFA®
04.03.2025 • Charles Wittmann, CFA®
03.28.2025 • James Kerin, CFA®
03.21.2025 • Andrew Richman, CTFA

Explore
