Skip Navigation

Higher Interest Rates & REITs - Looking Ahead at Lower New Supply

08.27.2024

Higher Interest Rates & REITs - Looking Ahead at Lower New Supply

Tags: Equity, Articles, Economic Updates

The market has spent much of the last two years fixated on the negative effects of rising rates on Real Estate Investment Trust (REIT) share prices. What has received less attention is the slowdown in new developments of commercial and multifamily real estate due to higher interest rates and the potential for higher rents in coming years should consistent demand growth be unmet by new supply. We believe publicly-traded REITs, which derive much of their earnings growth from existing real estate rather than new development, are overlooked future beneficiaries of this construction slowdown.

Prior to March of 2022, the Fed Funds Rate had stood in a range of 0-50 basis points (bps) since the Great Financial Crisis (GFC) of 2007-2008 and longer-term interest rates were similarly near all-time lows. As a result, borrowing costs were historically cheap and new construction of all types of commercial real estate and apartments boomed. Today’s higher rates are making development uneconomic and putting the brakes on new construction. The coming slowdown in fresh supply of real estate should be beneficial to cash flows for owners of existing real estate, in our view.

Herein we examine data showing the decline in overall new construction of commercial properties and focus on data for several property types that collectively make up over half of the major REIT benchmarks.

U.S. Commercial Construction Trending Lower

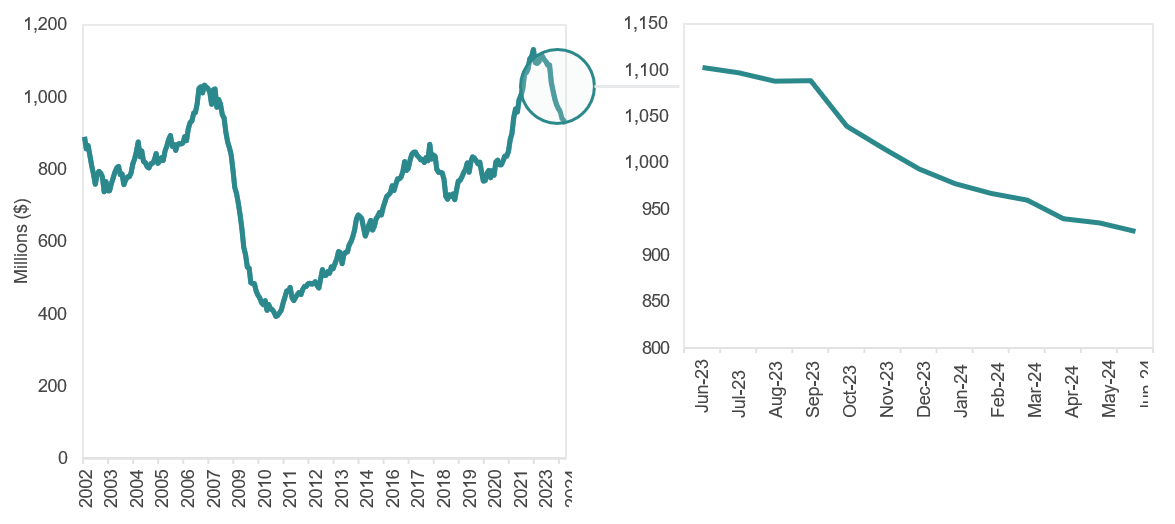
The total dollar value of commercial construction underway in the United States declined substantially following the GFC before gradually recovering in the following 12 years. In the aftermath of the COVID-19 pandemic, amidst record low interest rates, construction shot up further, reaching an inflation-adjusted level on par to the prior 2007 peak. However, as higher Fed Funds rates flowed through into construction loan interest rates, spending has inflected lower with new construction starts trailing completions.

Total U.S. Commercial Construction Spending, Adjusted for Inflation

Chart data is sourced from the Federal Reserve. Data is the dollar value of commercial construction spending in the United States, adjusted for inflation indexed at 01.01.2024. Charts are for illustrative purposes only. The views expressed represent the opinions of Sterling Capital Management. Any type of investing involves risk and there are no guarantees that these methods will be successful.

Leading Indicators Suggest a Continued Commercial Construction Slowdown

The Architectural Billings Index, a leading indicator for nonresidential construction activity with a historic lead time of 9-12 months, has been in contraction territory since August 2023. The Dodge Momentum Index, published monthly by McGraw-Hill Construction Analytics, declined from the middle of 2023 through May 2024, and is typically a 12-month leading indicator of construction spending for nonresidential buildings. While the Dodge Index has inflected upward the last two months, the improvement was primarily credited, by Dodge, to “data center planning” as well as hospital construction. In our view, this suggests apartment and non-data center commercial real estate development will remain sluggish.

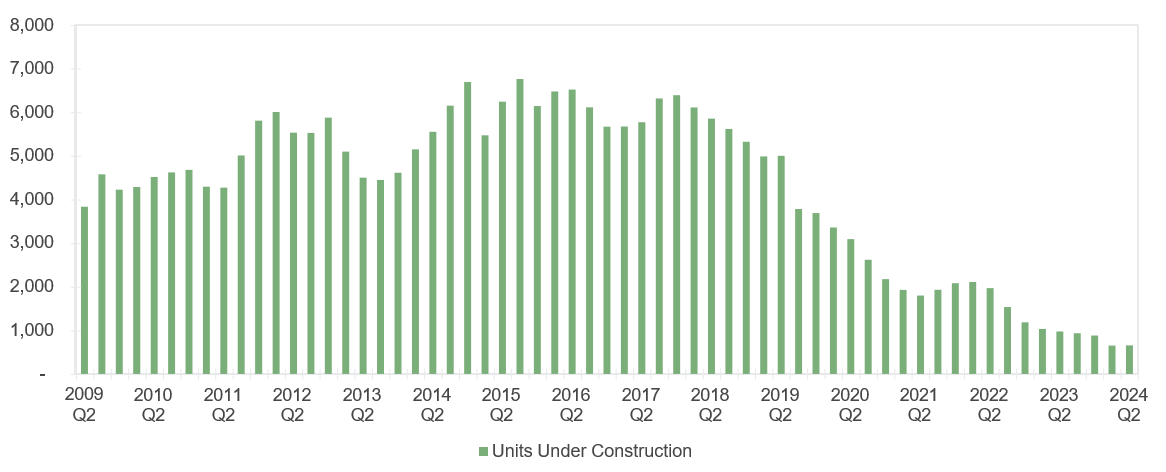
Residential REITs (15% of the Bloomberg U.S. REIT Index)

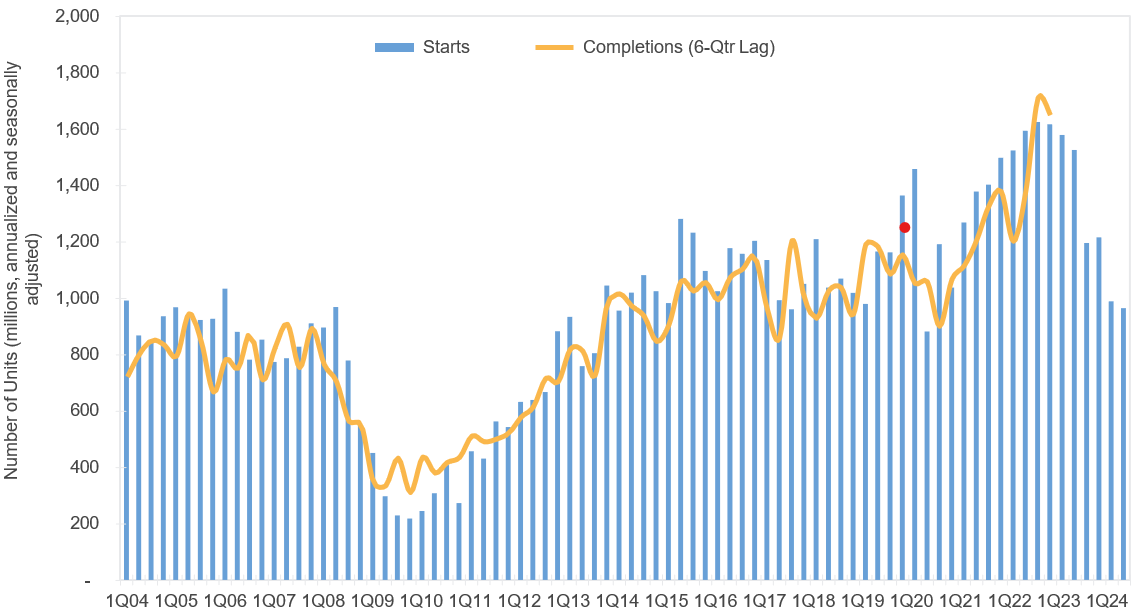
The post-COVID-19 rise in apartment rents has been a frequent theme in news stories focused on inflation drivers, though many highlight the expectation for 2024’s record new supply to reverse the trend by putting downward pressure on rent in the near future. However, looking beyond the current year, the data suggests new deliveries may fall. New construction starts have recently slowed to near long-term averages and commentary from REIT management teams during quarterly conference calls suggests starts may fall further. As shown below, the record amount of 2024 deliveries is a result of record new construction starts approximately 18 months ago. The subsequent slowdown in starts suggests fewer deliveries in 2025 and 2026, which should return pricing power to landlords.

Historical New Apartment Supply

Note: the line for “completions” is lagged six quarters from the bars for “starts.” Chart source: U.S. Census Bureau. Data is the number of housing starts and completions, measured by individual units within structures consisting of 5 or more total units. Units are in millions, annualized and seasonally adjusted. Charts are for illustrative purposes only. The views expressed represent the opinions of Sterling Capital Management. Any type of investing involves risk and there are no guarantees that these methods will be successful.

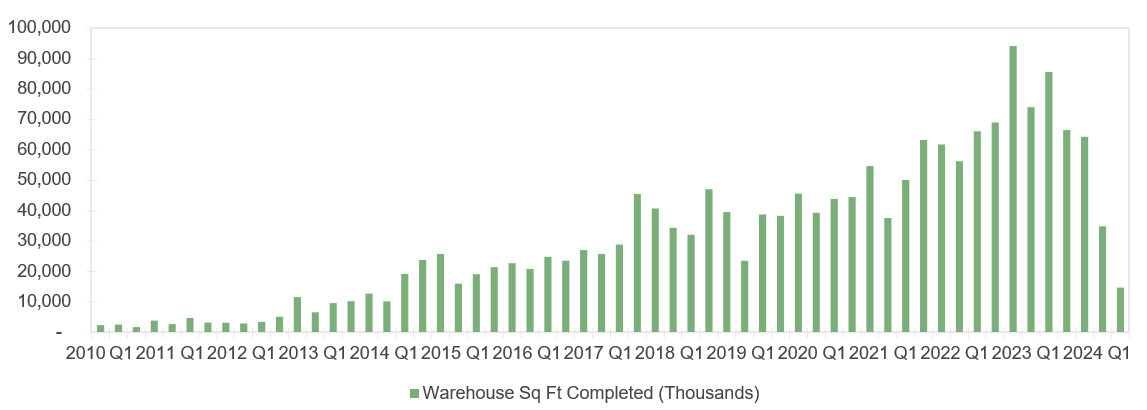
Retail REITs (14% of the Bloomberg U.S. REIT Index)

Construction of new retail space boomed during the mid-2000s as new shopping centers “followed the rooftops” of the single-family building craze that eventually led to the GFC later in the decade. As shown below, new retail construction declined markedly following 2008 and has remained at a low level.

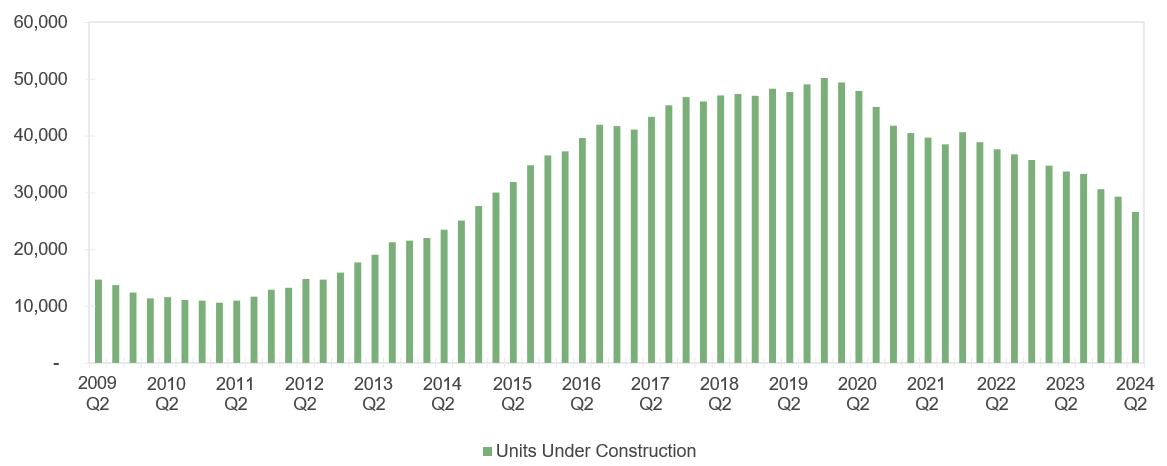
Healthcare REITs (10% of the Bloomberg U.S. REIT Index)

The healthcare subsector is dominated by REITs focused on two types of real estate – senior living properties and skilled nursing facilities. Construction of both property types was already declining ahead of the pandemic, due to oversupply of senior living and declining demand for skilled nursing. The immediate effects of post-COVID-19 regulatory scrutiny on both businesses kept new supply in check during the low-rate environment of 2020-2022, and higher interest rates are continuing to limit construction.

Historical New Senior Housing Supply
Historical New Skilled Nursing Property Supply

Chart data is sourced from Bloomberg. Charts are for illustrative purposes only. The views expressed represent the opinions of Sterling Capital Management. Any type of investing involves risk and there are no guarantees that these methods will be successful.


Important Information

Past performance is not indicative of future results. Any type of investing involves risk and there are no guarantees that these methods will be successful. Economic charts are provided for illustrative purposes only. The information provided herein is subject to market conditions and is therefore expected to fluctuate.

The opinions contained in this presentation reflect those of Sterling Capital Management LLC (SCM), are for general information only, and are educational in nature. The opinions expressed are as of the date of publication and are subject to change without notice. These opinions are not meant to be predictions and do not constitute an offer of individual or personalized investment advice. They are not intended as an offer or solicitation with respect to the purchase or sale of any security. This information and these opinions are subject to change without notice. All opinions and information herein have been obtained or derived from sources believed to be reliable. SCM does not assume liability for any loss which may result from the reliance by any person upon such information or opinions.

Investment advisory services are available through SCM, an investment adviser registered with the U.S. Securities & Exchange Commission and an indirect, wholly-owned subsidiary of Guardian Capital Group Limited. SCM manages customized investment portfolios, provides asset allocation analysis, and offers other investment-related services to affluent individuals and businesses.

Sterling Capital does not provide tax or legal advice. You should consult with your individual tax or legal professional before taking any action that may have tax or legal implications.

The Chartered Financial Analyst® (CFA) charter is a graduate-level investment credential awarded by the CFA Institute, the largest global association of investment professionals. To earn the CFA charter, candidates must: 1) pass three sequential, six-hour examinations; 2) have at least four years of qualified professional investment experience; 3) join CFA Institute as members; and 4) commit to abide by, and annually reaffirm, their adherence to the CFA Institute Code of Ethics and Standards of Professional Conduct.

Technical Term: The fed funds rate refers to the interest rate that depository institutions (such as banks and credit unions) charge other depository institutions for overnight lending of capital from their reserve balances on an uncollateralized basis. (The technical terms are sourced from Corporate Finance Institute.)

Real Estate-Related Investment and REIT Risk: Real estate-related investments may decline in value as a result of factors affecting the real estate industry. Risks associated with investments in securities of companies in the real estate industry include decline in the value of the underlying real estate, default, prepayment, changes in value resulting from changes in interest rates and demand for real and rental property, and the management skill and creditworthiness of REIT issuers. The strategy will indirectly bear its proportionate share of expenses, including management fees, paid by each REIT in which the strategy invests.

A Note on Indices: The volatility of an index varies greatly. All indices are unmanaged and investments cannot be made directly in an index.

The AIA/Deltek Architecture Billings Index (ABI) is a leading monthly economic indicator that uses proprietary AIA data to predict nonresidential construction activity 9–12 months ahead.

The Dodge Momentum Index is a measure of nonresidential building projects in the planning process.

The Bloomberg U.S. REIT Index is a float market-capitalization-weighted index that provides exposure to companies classified as per the Bloomberg Industry Classification System (BICS) with a level 3 sub-industry of REIT.

Bloomberg L.P. Information: “Bloomberg®” and the Bloomberg indices are service marks of Bloomberg Finance L.P. and its affiliates, including Bloomberg Index Services Limited (“BISL”), the administrator of the index (collectively, “Bloomberg”) and have been licensed for use for certain purposes by Sterling Capital Management LLC and its affiliates. Bloomberg is not affiliated with Sterling Capital Management LLC or its affiliates, and Bloomberg does not approve, endorse, review, or recommend the product(s) presented herein. Bloomberg does not guarantee the timeliness, accurateness, or completeness of any data or information relating to the product(s) presented herein.

About the Author


Photo of Andrew  DiZio

Andrew DiZio, CFA®

Portfolio Manager

Andrew T. DiZio, CFA®, Executive Director, joined the Stratton Funds team of Stratton Management Company in 2012 and Sterling Capital Management as part of a business acquisition in 2015. He has investment experience since 2003. Andy is portfolio manager of the Sterling Capital Mid Cap Relative Value and Sterling Capital Real Estate strategies and associate portfolio manager of the Sterling Capital Small Cap Value strategy. Prior to joining Sterling, he was vice president at Janney Montgomery Scott where he served as a Real Estate Investment Trust sector analyst. Andy received his B.S. in Finance with a minor in Economics from Pennsylvania State University. He holds the Chartered Financial Analyst® designation and is a member of the CFA® Society of Philadelphia and the CFA® Institute.

Related Insights


09.04.2024 • Charles Wittmann, CFA®

The Lead - Dividend Opportunities

08.13.2024
James Kerin, CFA®, Michael McVicker

Natural Gas Prepayment Bonds

Scroll Up