After two and a half years of battling elevated inflation with aggressive monetary policy tightening measures, the Federal Reserve (Fed) finally reduced the federal funds target rate range (fed funds rate) by 50 basis points during its September 2024 meeting. With recent inflation indicators seemingly within the Fed’s comfort zone, coupled with an increasing emphasis on supporting the labor market, we believe it’s highly likely that additional rate cuts are forthcoming.
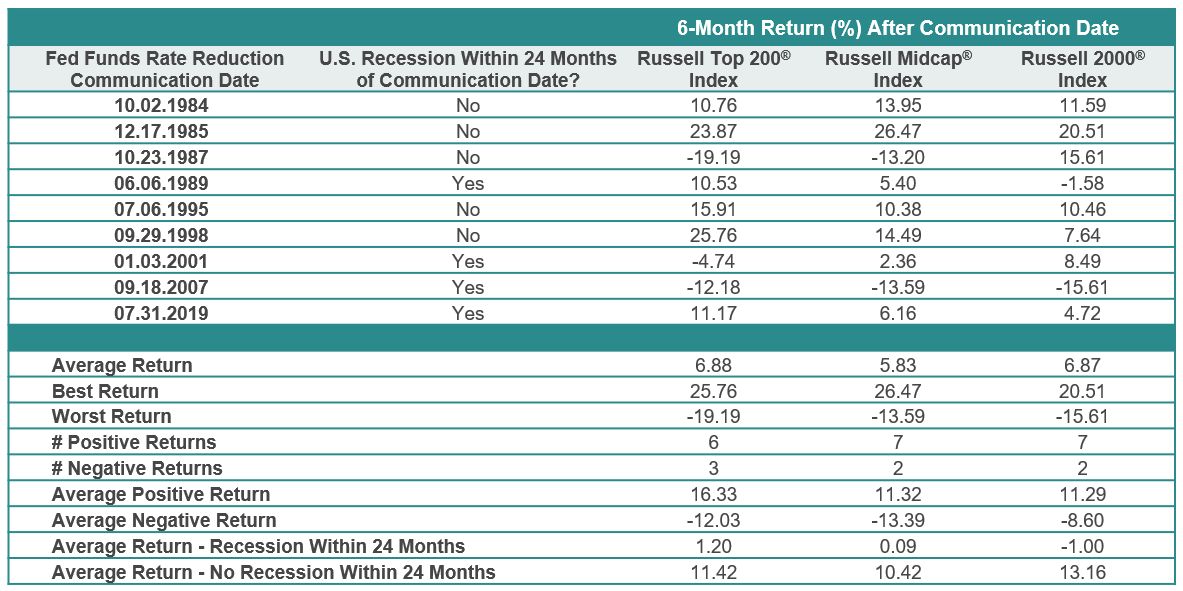
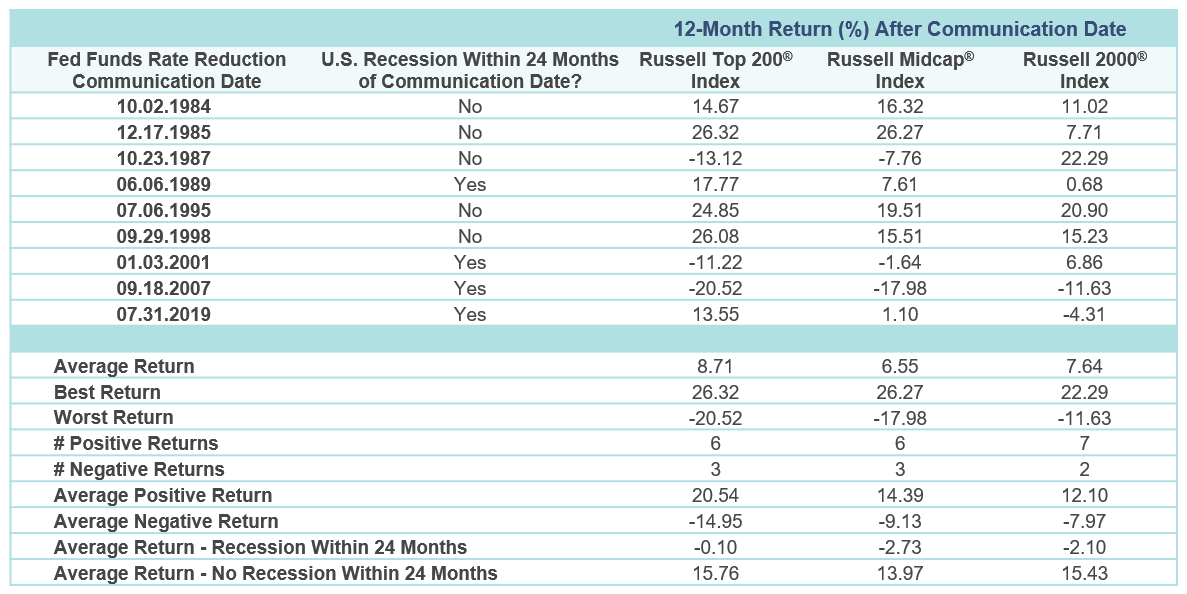
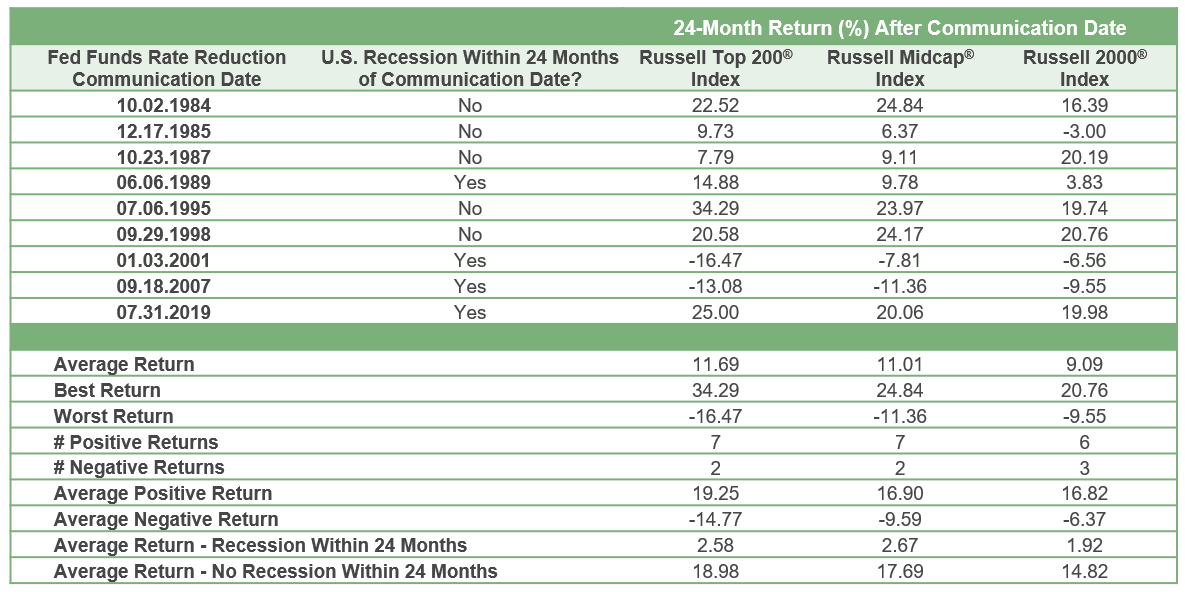
The charts below examine U.S. large-cap (Russell Top 200® Index), mid-cap (Russell Midcap® Index), and small-cap (Russell 2000® Index) equity market performance in 6-month, 12-month, and 24-month periods after the first fed funds rate cut within a monetary policy easing cycle, as defined by at least two fed funds rate cuts before the next rate hike.
Since monetary policy tools and communication methods used by the Fed have evolved over time, periods after 1994 (which marked a new approach in fed funds rate transparency) are most indicative of how the Fed currently operates and disseminates monetary policy. However, data going back to 1983 is used in this analysis as the post-1983 era represents a period in which inflation bottomed and remained range-bound after an extended period of relatively extreme movements in inflation and interest rates in the late 1970s and early 1980s. As such, it’s important to note that delays in monetary policy change communication prior to 1994 led to less definitive fed funds rate cut start dates during the 1983-1993 period. To overcome this challenge, data from David E. Lindsey’s A Modern History of FOMC Communication: 1975-2002 was used to define monetary policy change dates from 1983-1989.
Key Takeaways:
- U.S. Equities Have Historically Generated Positive Returns after the First Fed Funds Rate Cut
- On average, returns for large caps, mid caps, and small caps are positive in the 6-month, 12-month, and 24-month periods after the first rate cut in a rate cut cycle.
- Average returns during periods in which the U.S. economy did not experience a recession within 24 months of the first fed funds rate cut are higher than returns in periods in which a recession occurred within 24 months.
- However, average returns in the 24-month period following the first fed funds rate cut in which a recession occurred within 24 months of first fed funds rate cut are positive for all three market segments. In addition, average returns for all three segments are only slightly negative in the 12-month period following the first rate cut.
- Large Caps Have Historically Outperformed After the First Fed Funds Rate Cut
- Average returns for large caps over the 6-month, 12-month, and 24-month periods after the first fed funds rate cut outperformed mid caps and small caps.
- This outperformance was primarily driven by returns in which 6-month, 12-month, and 24-month periods were positive after the first rate cut.
- Large-cap outperformance is somewhat surprising in our opinion, especially in positive periods, as small caps generally have higher levels of floating rate debt when compared to large caps. All else equal, this dynamic may provide a larger tailwind for small caps as interest expense and/or cost of capital typically falls at a faster pace when compared to large caps.
- Small Caps Have Historically Been a Source of Downside Protection During Easing Cycles
- Small caps had the best “worst” return in the 12-month and 24-month periods and had the lowest average negative return across all time frames.
- This is somewhat counterintuitive given that small caps have historically had a higher risk profile when compared to large caps and mid caps and can be more sensitive to a slowdown in economic growth.
- However, small caps had the lowest average return during the 6-month and 24-month periods in which a recession occurred within 24 months of the first fed funds rate cut.
- In our view, small-cap outperformance in down periods supports the case for diversification, especially as many investors could be questioning the rationale for maintaining a diversified portfolio after U.S. large caps have outperformed other market segments for over a decade.
- “Stick to Your Plan” Regardless of Fed Monetary Policy
- Perhaps the most important takeaway, in our view, is the initiation of a fed funds rate easing cycle is not a compelling reason to make drastic changes to strategic asset allocation positioning.
- The data in the previous tables suggests that equities, on average, have historically produced positive results in the short-to-intermediate term periods following the initial fed funds rate cut in an easing cycle. While recessions have occurred shortly after the Fed begins reducing the fed funds rate, it’s difficult to predict the onset, duration, and severity of future recessions. Moreover, equities can produce positive results during recessions. Engaging in marketing timing (i.e., not staying fully invested) could potentially lead to missing out on positive returns.
- Finally, elevated volatility caused by changes in monetary policy may provide opportunities to take advantage of market dislocations by implementing risk-measured tactical asset allocation changes.
About the Author

Brandon Carl, CFA®, Executive Director, joined BB&T Asset Management in 2001 and SCM through merger in 2010. He has investment experience since 2001. Brandon is a Portfolio Manager on SCM's Advisory Solutions team with a focus on equity. Previously, he graduated from the BB&T Leadership Development Program and was an equity analyst covering the healthcare and consumer staples sectors for BB&T Asset Management. Brandon received his B.S. in Finance and Management from the University of South Carolina. He holds the Chartered Financial Analyst® designation.
Related Insights
08.25.2025 • Andrew Richman, CTFA
08.05.2025 • Charles Wittmann, CFA®
07.02.2025 • Charles Wittmann, CFA®
06.20.2025 • Andrew Richman, CTFA

Explore
