Quick thoughts on some recent developments under the market’s hood
Market selloffs are never pleasant for investors.
With that said, despite increasing signs of panic in the financial press as equity screens flash red, there are several things worth highlighting about this current bout of market volatility that do not yet suggest a mass exodus from stocks, including some that are welcome developments for those more active investors.
For starters, the MSCI World Index1 started today’s trading a whopping 1.5% (U.S. dollar basis) off its all-time high established on October 28 (just 13 trading days ago). Even incorporating the declines registered so far today (though U.S. markets have moved back into the green), the broad market is a fair distance away from “correction” territory (typically viewed as a 10% drawdown from its peak).
Again, selloffs in general are unpleasant, but this is not particularly severe at this point.
Secondly, just as there has been highly concentrated leadership as markets have increased in recent years, the market weakness thus far through November has largely been due to a fairly narrow subset of stocks rather than overly widespread declines — so, arguably more of a shift in allocations than wholesale selling.
For example, looking at the industry sectors of the stock market at a global level, Information Technology (-5.0%), Communication Services (-3.6%) and Consumer Discretionary (-2.3%) — areas of the market most tied to the outperforming artificial intelligence (AI) trade — are the clear underperformers. In contrast, Health Care (+4.7%), Energy (+2.9%), Financials (+0.8%) and Materials (+0.7%) are all in positive territory, and while the likes of Utilities (-0.1%), Consumer Staples (-0.3%) and Real Estate (-0.6%) are down marginally since the broad market turned in its highs, they are still notably outperforming the benchmark. This is consistent with a rotation away from those more expensive areas of the market that have generated strong returns.
MSCI World Index sector performance since October 28, 2025
(percent, U.S. dollar basis)
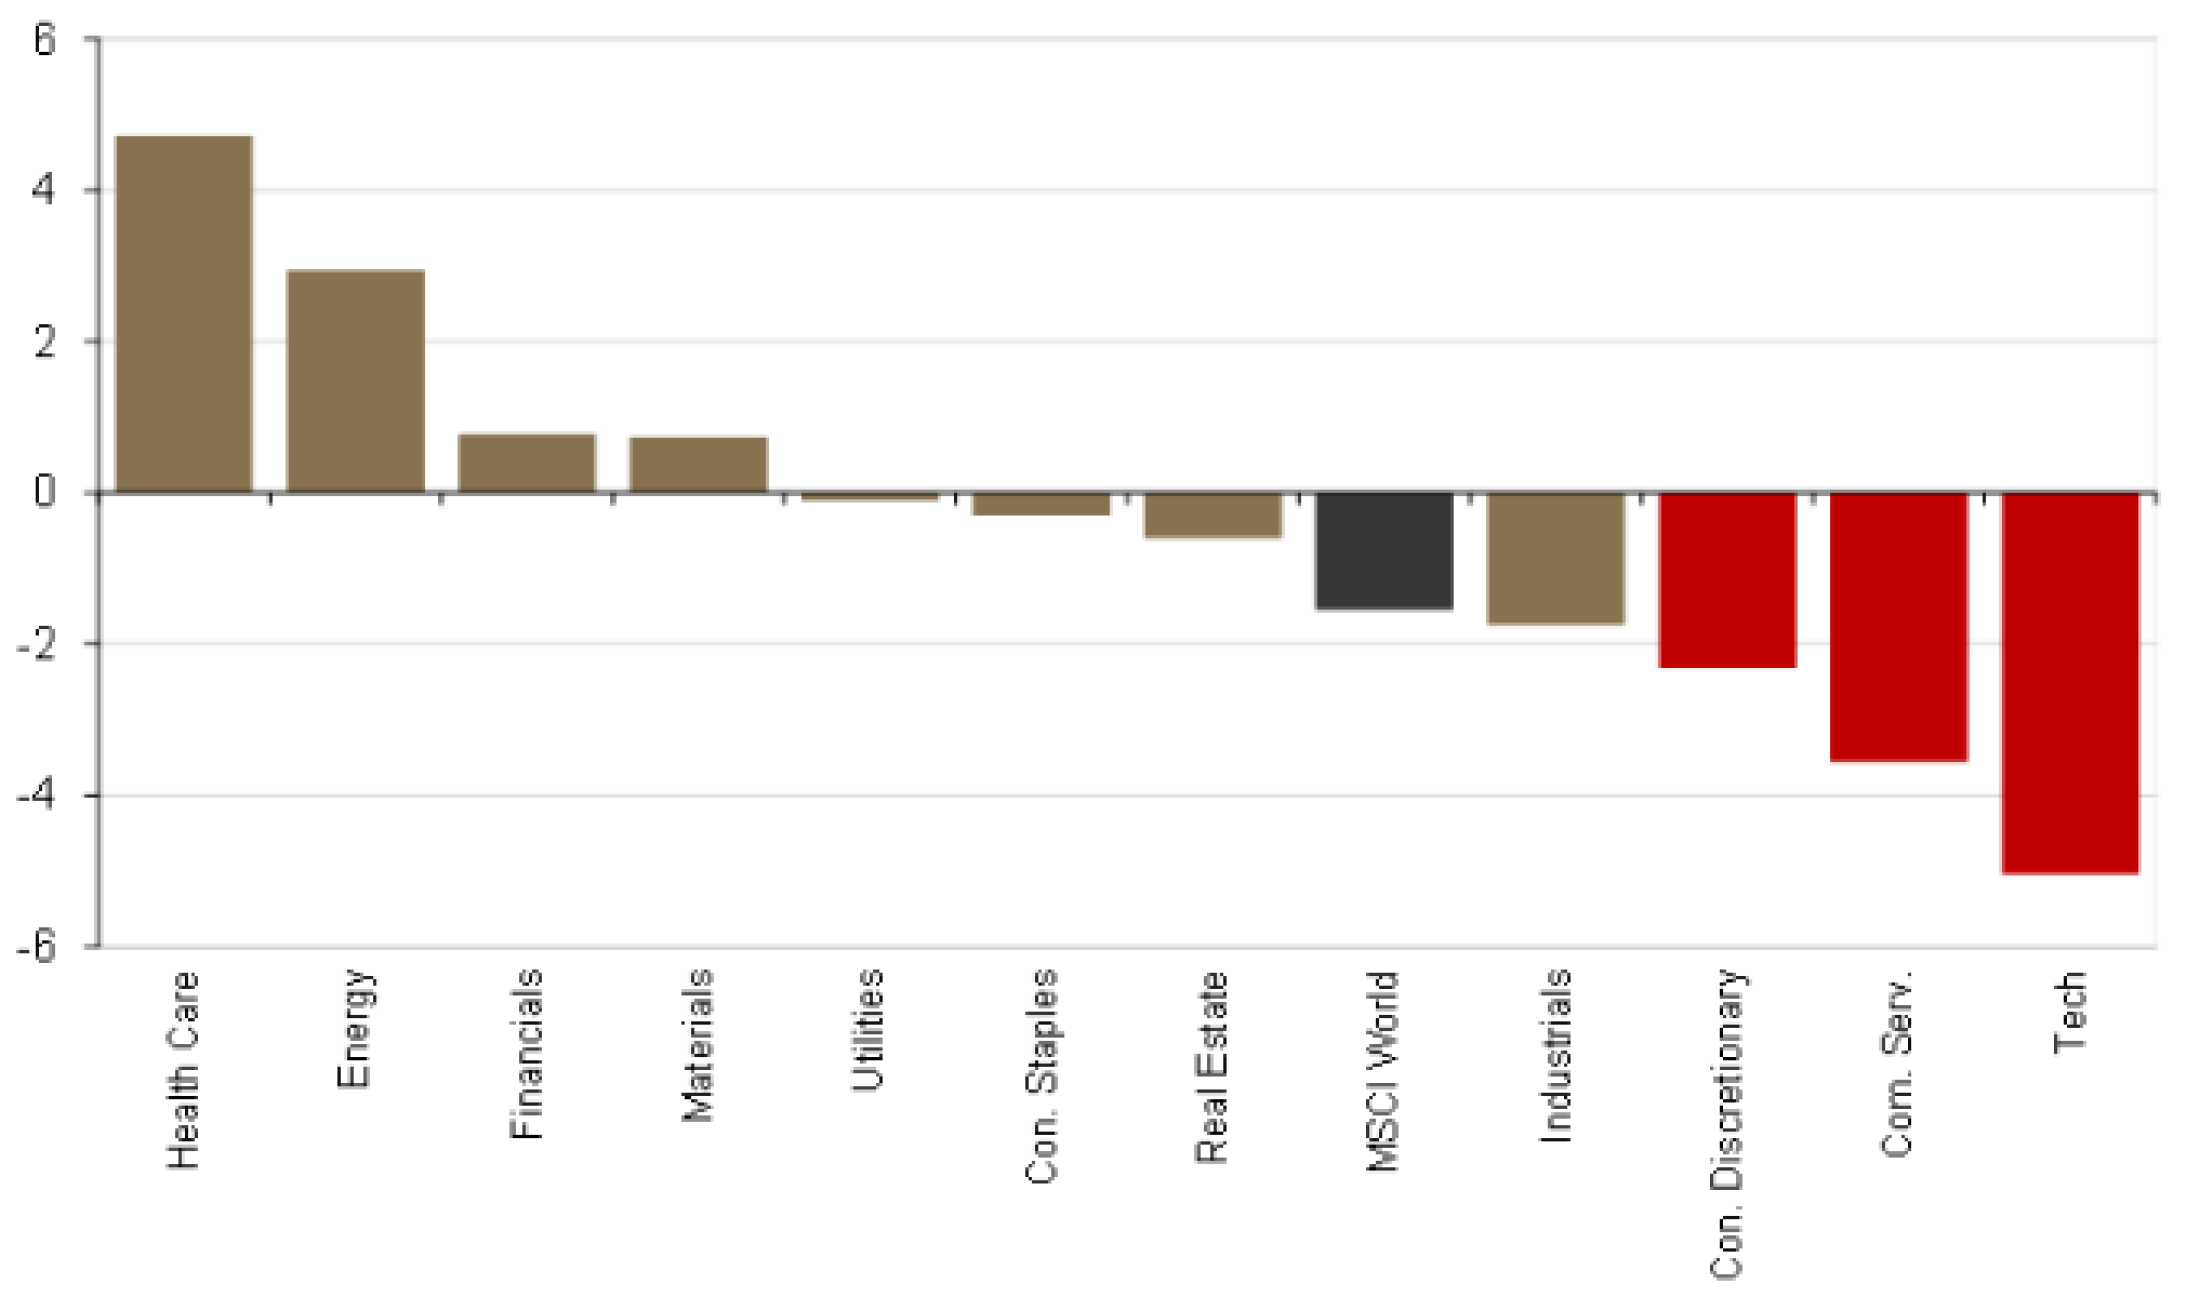
Source: Guardian Capital, using data from Bloomberg to November 13, 2025
This is echoed when looking at recent regional performance. The U.S. S&P 500 Composite Index2 is down 2.2% from its October 28 high; however, the Canadian S&P/TSX Composite Index3 is down just 1.0% in U.S. dollar terms over the period, while stocks in Europe, Australasia and the Far East are up (MSCI EAFE Index4 +0.9%). Excluding the (heavily-weighted) U.S. equity market, the MSCI World Index5 is actually up 0.6% over the last two-and-a-half weeks, with the equal-weighted6 version of this index (in which all stocks hold the same weighting and thus gives an idea of the “average stock”), seeing similar gains (+0.4%) is a sign that investment abroad has been fairly broad.
Moreover, if you drill a little deeper, there are other performance differences worth flagging. For example, the equal-weighted version of the MSCI World Index7 is down only 0.4% over the period of interest here, which represents more than 100 basis points worth of outperformance over the market-capitalization weighted index — this represents a significant turn relative to the previous six months, where the equal-weighted index’s performance trailed that of the standard MSCI World Index by more than 1,000 basis points.
The equal-weighted version of the S&P 5008 (-1.3% since October 28) is outperforming its market capitalization-weighted counterpart by a similar magnitude following significant underperformance — even just removing the (formerly high flying) “Magnificent 7” stocks (Alphabet, Amazon, Apple, Meta Platforms, Microsoft, Nvidia and Tesla), that have dropped 5.1% over this span, as per Bloomberg data, results in materially better performance versus the U.S. Large-Cap benchmark with the “S&P 493” down just 1.2% coming into trading today.
MSCI World Index sector performance since October 28, 2025
(percent, U.S. dollar basis)

Source: Guardian Capital, using data from Bloomberg to November 13, 2025
Something else that is important to note is that rather than coming against signs of material weakening in economic momentum — that can portend recessionary conditions that typically serve as a requisite for a severe and broad-based “bear market” selloff — available indicators point to sustained growth, and the current earnings season has been solid with improving guidance.
Looking at the S&P 500, 458 companies have reported earnings so far, and 376 (82%) of them have provided positive earnings surprises (68 missed; 14 in line with expectations) with the aggregate surprise being +7%.
The chart below lays out the sector-level earnings surprise and the subsequent 5-day price change: it shows that disappointing results in Communications Services have rightly been punished, while beats in the likes of Energy, Industrials, Staples, Materials, Health Care have been rewarded (i.e. reasonable market responses to fundamentals) — but note that beats in Tech and Consumer Discretionary (and even Artificial Intelligence (AI)-power-related American Utilities) have been met by declines.
S&P 500 earnings surprise price reaction, Q3 2025
(percent, U.S. dollar basis)
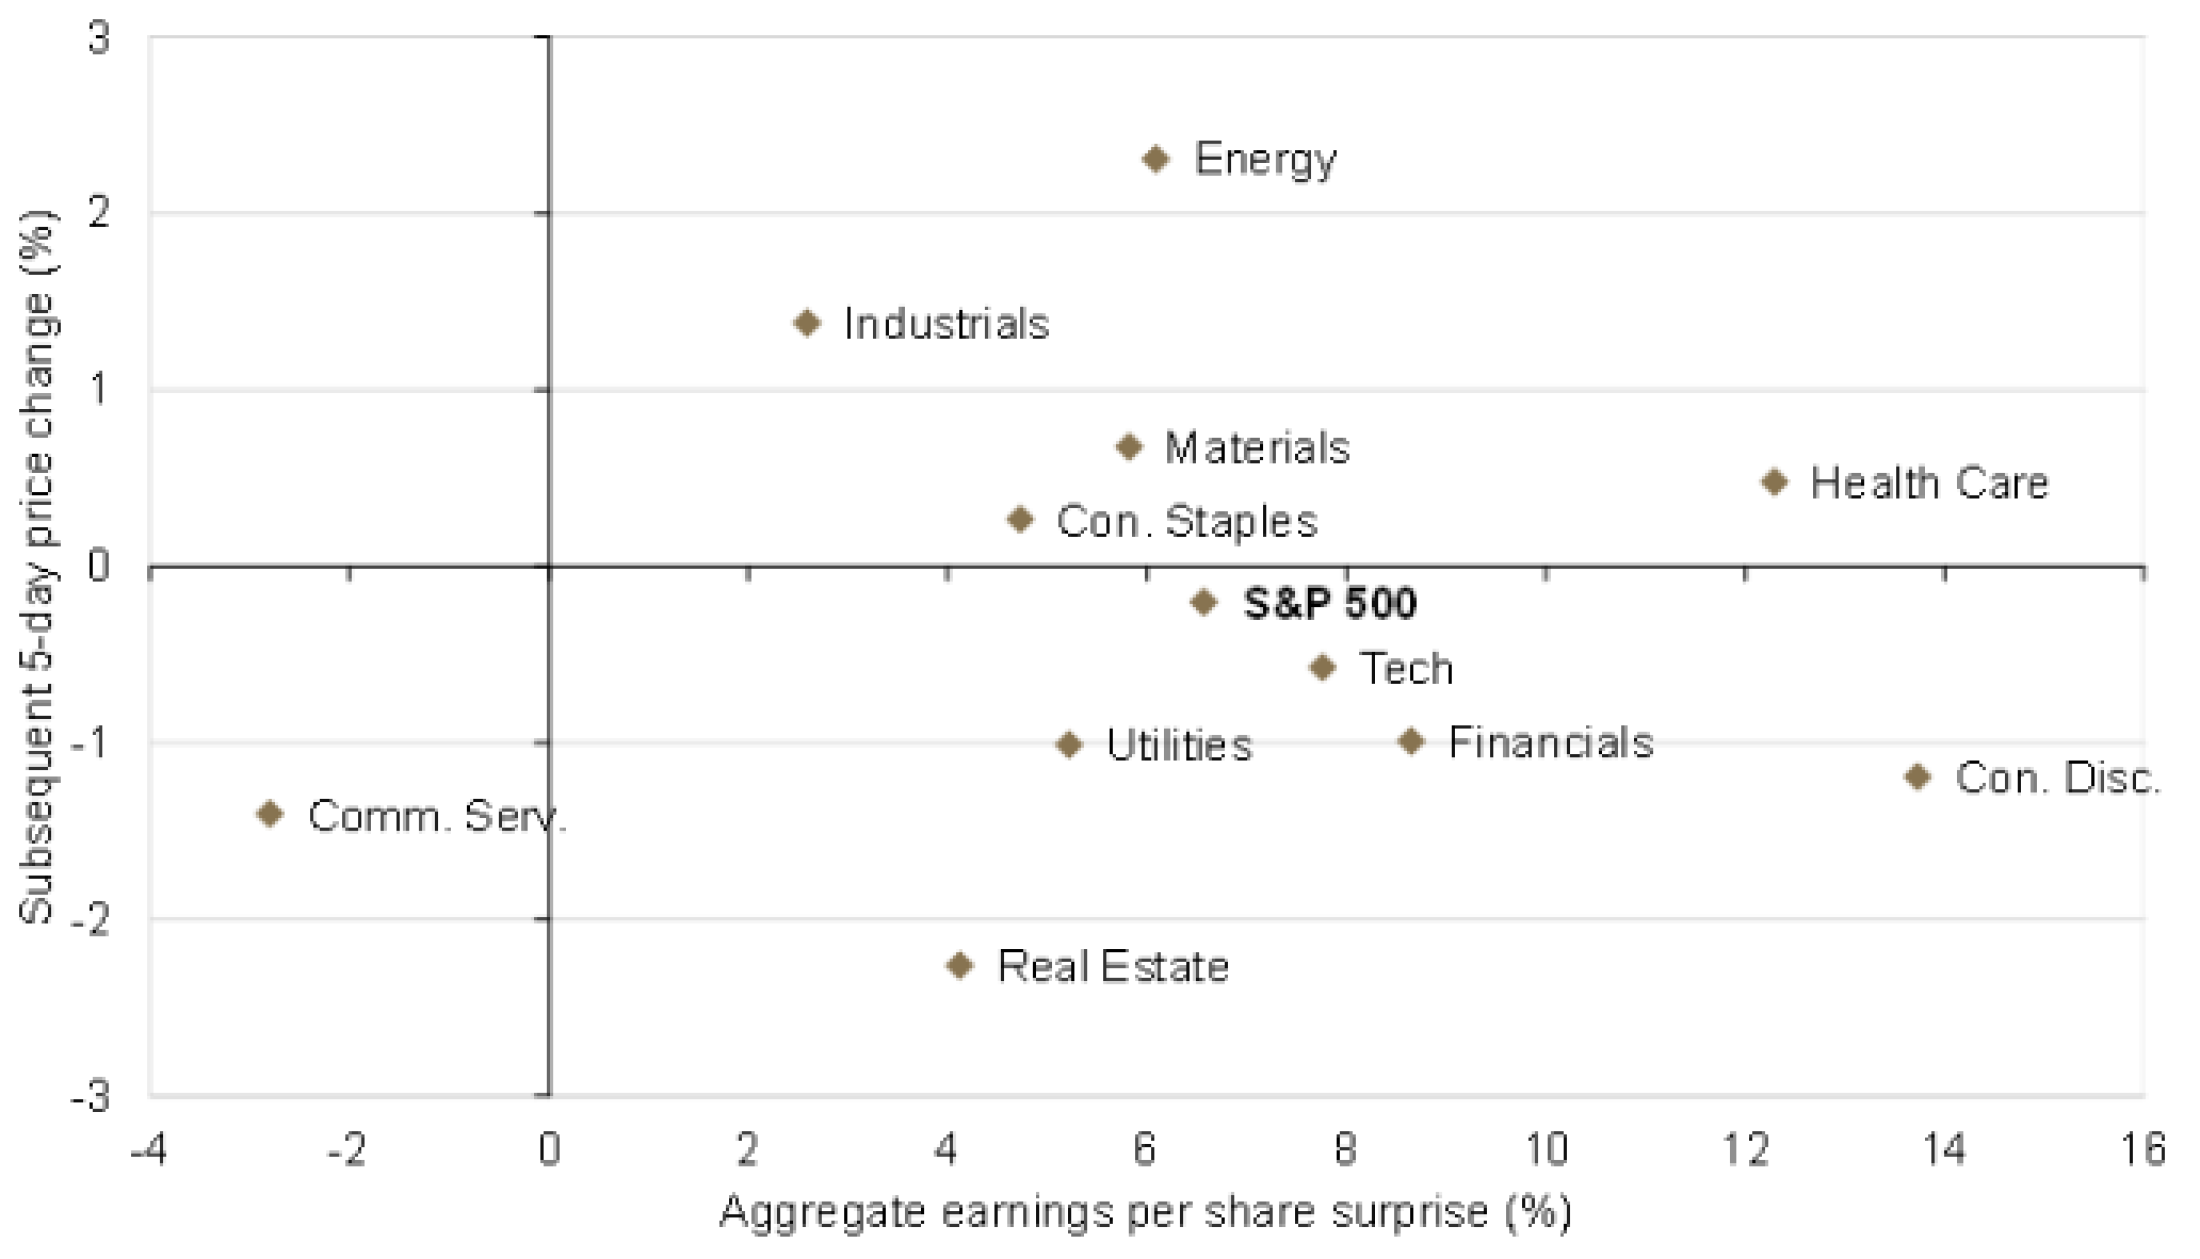
Source: Guardian Capital, using data from Bloomberg covering the period from August 16 to November 14, 2025
Put together, this suggests that there may be a growing willingness to take profit/trim exposures in the narrow (and expensive) AI/Tech trades that have massively outperformed in recent years and reallocate to other (less expensive) areas of the market.
Given the substantial gap that has developed between the “Magnificent 7” (and those adjacent) and everybody else, there is scope for this shift to be sustained as investors put new money into other areas of the market that have solid fundamentals as growth forecasts stabilize — something that could create further positive relative performance for those more active investors that have struggled in recent years due to the narrow leadership in the marketplace.
_____________
David Onyett-Jeffries
David Onyett-Jeffries is Vice President, Economics & Multi Asset Solutions, at Guardian Capital LP (GCLP). He provides macroeconomic guidance to GCLP and its affiliates. Additionally, he is a portfolio manager of GCLP’s multi-asset portfolios and funds and works closely with GCLP’s Directed Outcomes team.
1 The MSCI World Index captures mid- and large-cap representation across 23 developed market countries.
2 The S&P 500 is an index of 500 stocks designed to reflect the risk/return characteristics of the large-cap US equity universe.
3 The S&P/TSX Composite Index is the benchmark Canadian index, representing roughly 70% of the total market capitalization on the Toronto Stock Exchange (TSX) with about 250 companies included in it.
4 The MSCI EAFE Index is a stock market index that is designed to measure the equity market performance of developed markets outside of the U.S. & Canada.
5 The MSCI World ex USA Index captures large and mid-cap representation across 22 of 23 Developed Markets DM countries*–excluding the United States. With 776 constituents, the index covers approximately 85% of the free float-adjusted market capitalization in each country.
6 The MSCI World ex USA Equal Weighted Index represents an alternative weighting scheme to its market-cap-weighted parent index, the MSCI World ex USA Index. The index includes the same constituents as its parent (large and mid-cap securities from 22 Developed Markets countries*). However, at each quarterly rebalance date, all index constituents are weighted equally, effectively removing the influence of each constituent’s current price (high or low). Between rebalances, index constituent weightings will fluctuate due to price performance.
7 The MSCI World Equal Weighted Index represents an alternative weighting scheme to its market-cap-weighted parent index, the MSCI World Index. The index includes the same constituents as its parent (large and mid-cap securities from 23 Developed Markets countries*). However, at each quarterly rebalance date, all index constituents are weighted equally, effectively removing the influence of each constituent’s current price (high or low). Between rebalances, index constituent weightings will fluctuate due to price performance.
8 The S&P 500® Equal Weight Index (EWI) is the equal-weight version of the widely used S&P 500. The index includes the same constituents as the capitalization-weighted S&P 500, but each company in the S&P 500 EWI is allocated a fixed weight, or 0.2% of the index total, at each quarterly rebalance.
Recent Insights
03.11.2026 • Charles Wittmann, CFA®
02.11.2026 • Charles Wittmann, CFA®
01.13.2026 • Charles Wittmann, CFA®
12.11.2025 • Charles Wittmann, CFA®