Skip Navigation

Down but Not Out: Why Mid-Cap Value Appears Increasingly Attractive

09.12.2024

Down but Not Out: Why Mid-Cap Value Appears Increasingly Attractive

Tags: Equity, Articles, Economic Updates, White Papers

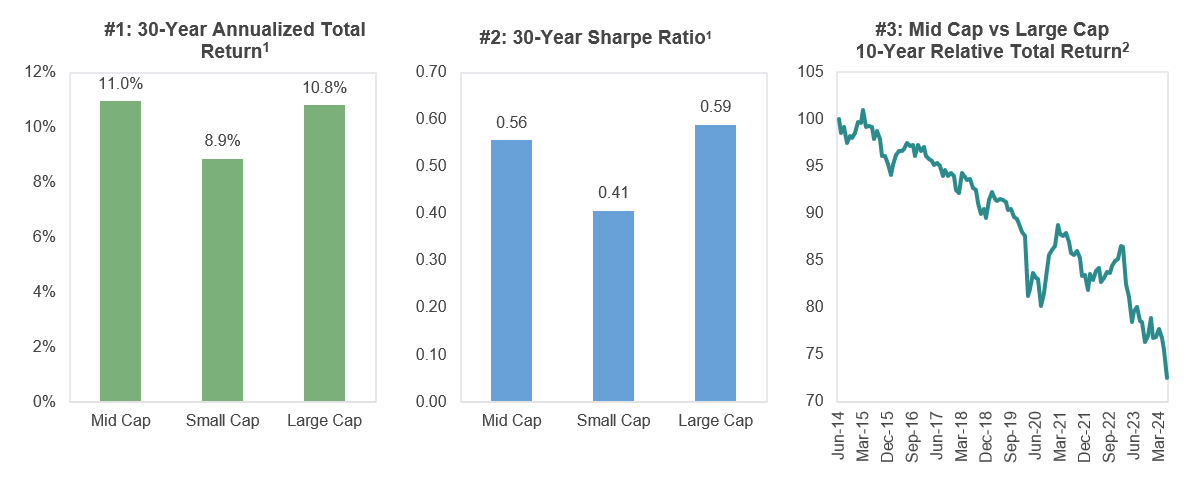
For almost a decade, large-cap growth has been a dominant factor driving market returns. However, we see mounting evidence mid-cap value stocks are due for a comeback. We have long argued mid caps are a potential “sweet spot” for investors. We believe they boast better liquidity, stronger balance sheets, and more durable competitive advantages than small-cap peers and are often more nimble, focused, and less well covered by the sell side than large caps. This combination has led to strong risk-adjusted returns. Below we show the thirty-year annualized returns for large, mid, and small caps measured by the Russell 1000® Index, Russell MidCap® Index, and Russell 2000® Index, respectively (Chart #1). For total return, mid caps have edged out large caps and comfortably beaten small caps all with favorable risk-adjusted metrics (Chart #2). Mid cap’s long-term performance is notable, as it includes the sharp underperformance relative to large caps over the last decade (Chart #3). With that as today’s setup, we believe it is a good time to revisit the category.

We attribute much of mid cap’s recent underperformance to the anomalous concentration in market returns. The S&P 500® Index has returned +14.5% through 2Q24, but 57% has come from five stocks: Nvidia, Alphabet, Microsoft, Meta and Amazon. Nvidia alone has contributed 30%, the largest by a single stock in over a century. This echoes last year when those same five companies accounted for almost half the index’s return. To put this in context, there have only been nine instances where five stocks or fewer have contributed at least 40% of market returns in the last sixty years. We just experienced two back-to-back.

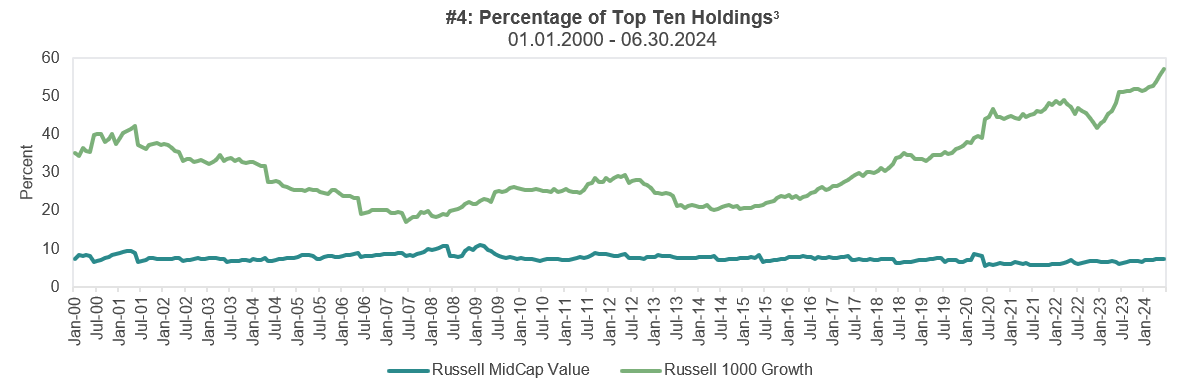
This ever-increasing concentration is now spilling into index construction. Russell reconstitutes its benchmarks each June, and we believe there are some noteworthy stats this year. The top ten holdings of the Russell 1000® Growth Index now account for 60% of the index (Chart #4), the highest concentration ever. The Russell Midcap® Growth Index only has 288 constituents, the fewest ever. Meanwhile the Russell Midcap® Value Index boasts 713 holdings, roughly in-line with history, and the top ten account for 7.4%, slightly below the historic average of 7.6%.

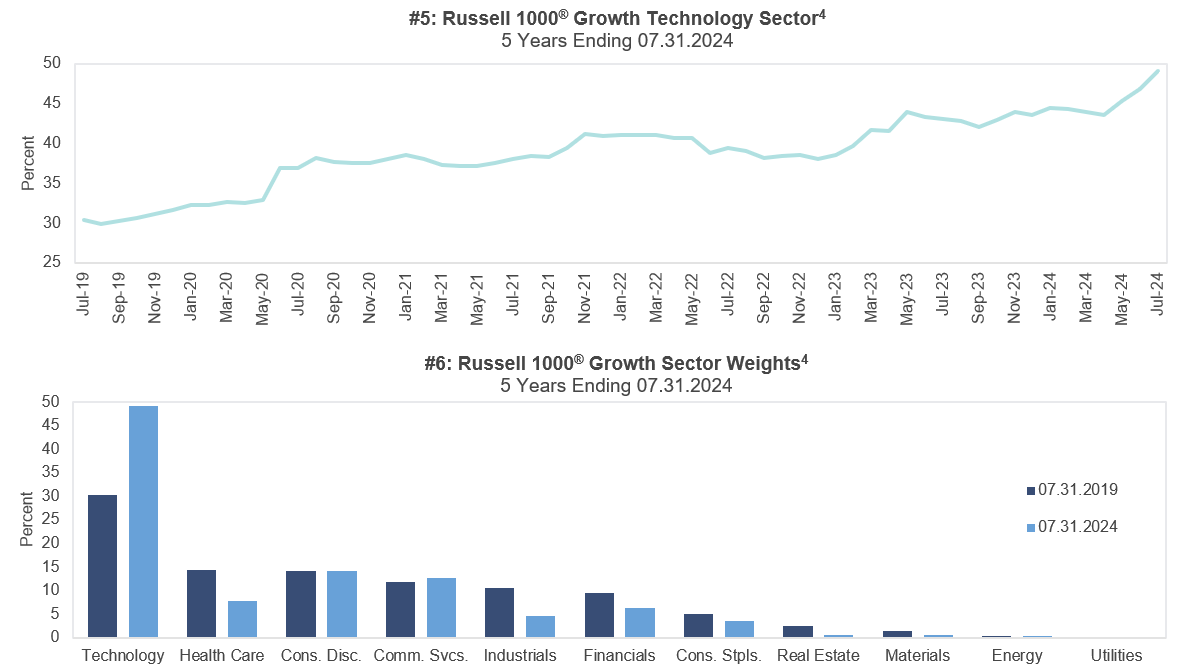
An analysis at the sector level (Chart #5, #6) highlights even greater disparities. The Russell 1000® Growth now has a 50% weighting to technology, the highest ever, and more than 5x higher than its value equivalent, the Russell 1000® Value. Concentration is now so high that many indices would run afoul of the requirements to be considered diversified funds stipulated in the Investment Company Act of 1940. We see this as a risk for allocators and one that may be reduced by revisiting mid-cap value where concentration remains in line or below history.

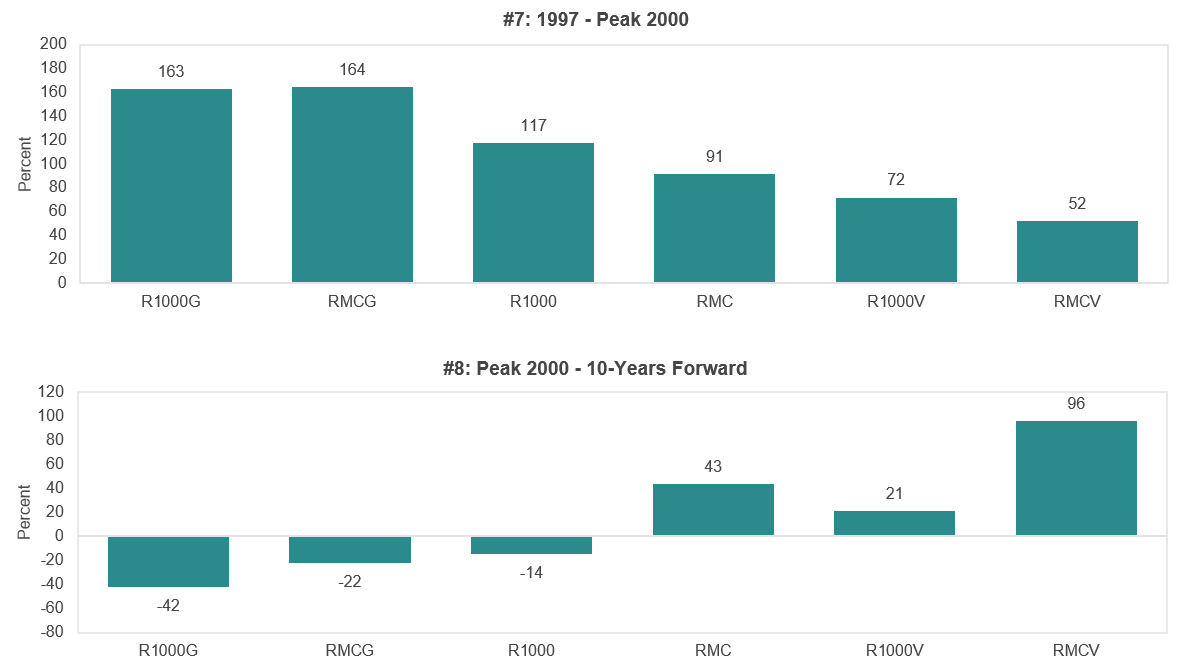
History provides some context regarding whether large-cap growth can continue to dominate forward returns. Investors saw a similar scenario in the run up to the dot-com bubble where large-cap growth stocks trounced their mid-cap value peers (Chart #7). However, once the bubble burst, mid caps delivered a decade of solid performance. The Russell Midcap® Value nearly doubled while the Russell 1000® Growth declined a cumulative 42% (Chart #8). We argue the starting point looks similar today given the magnitude of large cap’s overperformance over the last ten years and the current enthusiasm for technology stocks.

In conclusion, we are optimistic on mid caps given their history of strong returns and attractive risk metrics. It is always difficult to call the peak of a cycle, however we believe the current setup is favorable. Today’s unprecedented concentration suggests the spring is coiled tightly should a recovery materialize. For almost twenty years our strategy has aimed to own good businesses with good management at a good price. We are hopeful these attributes will prove favorable as the breadth of the market widens in time.


Disclosures

Past performance is not indicative of future results. Any type of investing involves risk and there are no guarantees that these methods will be successful. Economic charts are provided for illustrative purposes only. The information provided herein is subject to market conditions and is therefore expected to fluctuate.

The opinions contained in this presentation reflect those of Sterling Capital Management LLC (SCM), are for general information only, and are educational in nature. The opinions expressed are as of the date of publication and are subject to change without notice. These opinions are not meant to be predictions and do not constitute an offer of individual or personalized investment advice. They are not intended as an offer or solicitation with respect to the purchase or sale of any security. This information and these opinions are subject to change without notice. All opinions and information herein have been obtained or derived from sources believed to be reliable. SCM does not assume liability for any loss which may result from the reliance by any person upon such information or opinions.

Investment advisory services are available through SCM, an investment adviser registered with the U.S. Securities & Exchange Commission and an indirect, wholly-owned subsidiary of Guardian Capital Group Limited. SCM manages customized investment portfolios, provides asset allocation analysis, and offers other investment-related services to affluent individuals and businesses.

SCM does not provide tax or legal advice. You should consult with your individual tax or legal professional before taking any action that may have tax or legal implications.

Specific securities identified and described do not represent all of the securities purchased, sold or recommended to clients. There are no assurances that securities identified will be profitable investments. The securities described are neither a recommendation nor a solicitation. Security information is being obtained from resources the firm believes to be accurate, but no warrant is made as to the accuracy or completeness of the information.

The Chartered Financial Analyst® (CFA) charter is a graduate-level investment credential awarded by the CFA Institute, the largest global association of investment professionals. To earn the CFA charter, candidates must: 1) pass three sequential, six-hour examinations; 2) have at least four years of qualified professional investment experience; 3) join CFA Institute as members; and 4) commit to abide by, and annually reaffirm, their adherence to the CFA Institute Code of Ethics and Standards of Professional Conduct.  

Technical Terms: a Sharpe Ratio is commonly used to gauge the performance of an investment by adjusting for its risk. Dotcom Bubble is a stock market bubble that was caused by speculation in dotcom or internet-based businesses from 1995 to 2000. The Investment Company Act of 1940 is an act of Congress that regulates the organization of investment companies and the activities they engage in. It sets standards for the investment company industry. A primary purpose of the Act is to protect investors by ensuring that they're aware of the risks associated with buying and owning securities. (The technical terms are sourced from Corporate Finance Institute and Investopedia.)

A Note on Indices: The volatility of an index varies greatly. All indices are unmanaged and investments cannot be made directly in an index.

The Russell 1000® Index measures the performance of the large-cap segment of the U.S. equity universe. It is a subset of the Russell 3000® Index and includes approximately 1,000 of the largest securities based on a combination of their market cap and current index membership. The Russell 1000® represents approximately 92% of the U.S. market. The Russell 1000® Index is constructed to provide a comprehensive and unbiased barometer for the large-cap segment and is completely reconstituted annually to ensure new and growing equities are included.

The Russell 1000® Growth Index measures the performance of the large-cap growth segment of the U.S. equity universe. It includes those Russell 1000® companies with higher price-to-book ratios and higher forecasted growth values. The Russell 1000® Growth Index is constructed to provide a comprehensive and unbiased barometer for the large-cap growth segment. The index is completely reconstituted annually to ensure new and growing equities are included and that the represented companies continue to reflect growth characteristics.

The Russell 1000® Value Index measures the performance of the large-cap value segment of the U.S. equity universe. It includes those Russell 1000® companies with lower price-to-book ratios and lower expected growth values. The Russell 1000® Value Index is constructed to provide a comprehensive and unbiased barometer for the large-cap value segment. The index is completely reconstituted annually to ensure new and growing equities are included and that the represented companies continue to reflect value characteristics.

The Russell Midcap® Index measures the performance of the mid-cap segment of the U.S. equity universe. The Russell Midcap® Index is a subset of the Russell 1000® Index. It includes approximately 800 of the smallest securities based on a combination of their market cap and current index membership. The Russell Midcap® Index represents approximately 31% of the total market capitalization of the Russell 1000® companies. The Russell Midcap® Index is constructed to provide a comprehensive and unbiased barometer for the mid-cap segment. The index is completely reconstituted annually to ensure larger stocks do not distort the performance and characteristics of the true mid-cap opportunity set.

The Russell Midcap® Growth Index measures the performance of the midcap growth segment of the U.S. equity universe. It includes those Russell Midcap® Index companies with higher price-to-book ratios and higher forecasted growth values. The Russell Midcap® Growth Index is constructed to provide a comprehensive and unbiased barometer of the mid-cap growth market. The index is completely reconstituted annually to ensure larger stocks do not distort the performance and characteristics of the true mid-cap growth market.

The Russell Midcap® Value Index measures the performance of the midcap value segment of the U.S. equity universe. It includes those Russell Midcap® Index companies with lower price-to-book ratios and lower forecasted growth values. The Russell Midcap® Value Index is constructed to provide a comprehensive and unbiased barometer of the mid-cap value market. The index is completely reconstituted annually to ensure larger stocks do not distort the performance and characteristics of the true midcap value market.

The Russell 2000® Index measures the performance of the small-cap segment of the U.S. equity universe. The Russell 2000® Index is a subset of the Russell 3000® Index representing approximately 10% of the total market capitalization of that index. It includes approximately 2,000 of the smallest securities based on a combination of their market cap and current index membership. The Russell 2000® is constructed to provide a comprehensive and unbiased small-cap barometer and is completely reconstituted annually to ensure larger stocks do not distort the performance and characteristics of the true small-cap opportunity set.

The S&P 500® Index is a readily available, carefully constructed, market-value-weighted benchmark of common stock performance. Currently, the S&P 500 Composite includes 500 of the largest stocks (in terms of stock market value) in the United States and covers approximately 80% of available market capitalization.

About the Author


Photo of Will  Smith

Will Smith, CFA®

Fundamental Equity; Portfolio Manager

Will C. Smith, CFA®, Executive Director, joined Sterling Capital Management in 2015 and has investment experience since 2002. Will is a co-portfolio manager of Sterling’s Fundamental Equity Small Cap Value strategy and Fundamental Equity Mid Cap Value strategy. Prior to joining Sterling, he was an executive director with Goldman Sachs in London as the lead sell side analyst covering the global media and telecommunications sector. Prior to Goldman Sachs, he worked for Jefferies International as the lead sell side analyst covering the global media sector. Will received his B.E. in Structural Engineering from Vanderbilt University and his M.B.A. from the London Business School. He holds the Chartered Financial Analyst® designation.

Related Insights


09.04.2024 • Charles Wittmann, CFA®

The Lead - Dividend Opportunities

08.13.2024
James Kerin, CFA®, Michael McVicker

Natural Gas Prepayment Bonds

Scroll Up