Skip Navigation

The Lead - Raising the Bar

03.07.2025

The Lead - Raising the Bar

Tags: Equity, Economic Updates

The Top Quintile of Nine-Month Stock Price Trends*

Trailing 12-Month Returns (1953 - February 2025)

<br />
<b>Notice</b>:  Undefined index: alt in <b>/mnt/target05/331796/385567/www.sterlingcapital.com/web/content/assets/views/detailed_image.php</b> on line <b>14</b><br />

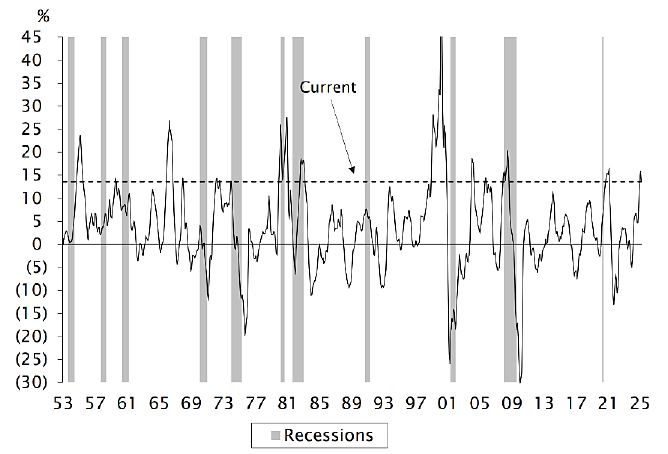
This month, we’re happy to share some market dynamics that we observed anecdotally but now have facts and figures to support. For the past two years, investors have experienced a powerful momentum-driven market. In investing, momentum is like a train – once it gets started, it is propelled in the same direction. Momentum investing capitalizes on our herding behavior when investors choose upward-trending stock prices and believe they will continue. Many times they will combine signals, such as when analysts who publish earnings estimates on these companies’ stocks revise their earnings forecasts upward to help verify the upward direction of a stock.

In terms of price momentum, we can see from the Empirical Research chart at the top of the page that over the last 12 months, price momentum has had one of the best performance periods in seventy years. Earnings revisions tend to have short performance signals, but we believe there is a common thread between price momentum and earnings momentum, as seen in the chart to the right. It shows that stocks that have seen their earnings estimates revised upward have consistently outperformed over the following month.

Typically, this type of tight relationship is seen coming out of a recession. We believe the 50 basis point (bp) fed funds rate cut last year (the first this century outside of a major crisis such as the housing crisis, Global Financial Crisis, or COVID-19) contributed to this differentiated dynamic in late 2024.

Relative Returns to the Top Quintile of Earnings Revisions for Large Capitalization Stocks*

2024 - February 2025

<br />
<b>Notice</b>:  Undefined index: alt in <b>/mnt/target05/331796/385567/www.sterlingcapital.com/web/content/assets/views/detailed_image.php</b> on line <b>14</b><br />

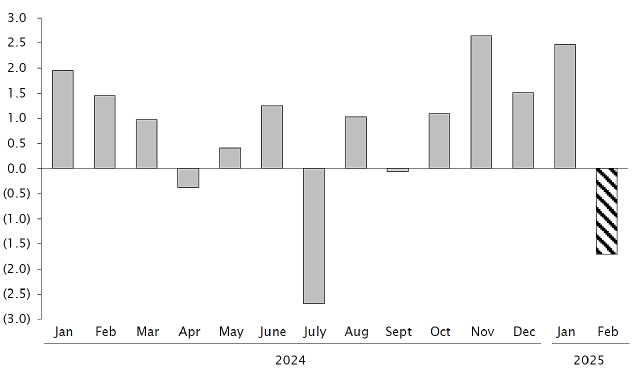
This past month has been challenging for momentum stocks and earnings revisions as the bar for earnings revisions has been raised.

Dividend Payers Jumped to 2.5 Month High versus Non-Payers

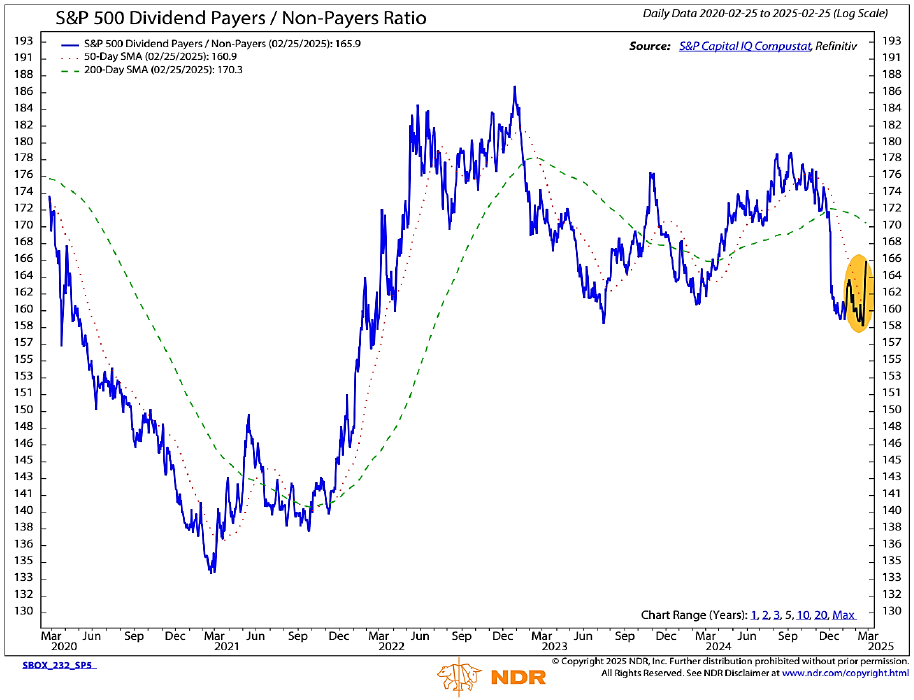
Conversely, dividend payers have perked up after underperforming materially since the 50 bp rate cut. What gives? We believe that with the Federal Reserve (Fed) signaling mid-month that interest rates may remain closer to their 2023 high than they expected due to persistent inflation concerns, the prospects for a more challenging macroeconomic environment increased the appeal for dividend-paying stocks. Our observation is that the aggressive monetary policy in late 2024 accentuated momentum linked to earnings revisions, especially in economically sensitive stocks with non-payers outperforming dividend payers, as seen in the chart above. With the Fed signaling less stimulus in 2025, we may see more of a balance in stock performance between dividend payers and non-payers.

As always, thank you for your interest and trust managing your investments.


Disclosures

Past performance is not indicative of future results. Any type of investing involves risk and there are no guarantees that these methods will be successful. Economic charts are provided for illustrative purposes only. The information provided herein is subject to market conditions and is therefore expected to fluctuate.

The opinions contained in the preceding presentation reflect those of Sterling Capital Management LLC, and not those of Truist Financial Corporation or its executives. The stated opinions are for general information only and are educational in nature. These opinions are not meant to be predictions or an offer of individual or personalized investment advice. They are not intended as an offer or solicitation with respect to the purchase or sale of any security. This information and these opinions are subject to change without notice. All opinions and information herein have been obtained or derived from sources believed to be reliable. Sterling Capital Management LLC does not assume liability for any loss which may result from the reliance by any person upon such information or opinions.

Investment advisory services are available through Sterling Capital Management LLC, an investment adviser registered with the U.S. Securities & Exchange Commission and an independently-operated subsidiary of Truist Financial Corporation. Sterling Capital Management LLC manages customized investment portfolios, provides asset allocation analysis and offers other investment-related services to affluent individuals and businesses. Securities and other investments held in investment management or investment advisory accounts at Sterling Capital Management LLC are not deposits or other obligations of Truist Financial Corporation, Truist Bank or any affiliate, are not guaranteed by Truist Bank or any other bank, are not insured by the FDIC or any other federal government agency, and are subject to investment risk, including possible loss of principal invested.

Sterling Capital does not provide tax or legal advice. You should consult with your individual tax or legal professional before taking any action that may have tax or legal implications.

The securities described are neither a recommendation nor a solicitation. Security information is being obtained from resources the firm believes to be accurate, but no warrant is made as to the accuracy or completeness of the information.

The volatility of an index varies greatly. All indices are unmanaged and investments cannot be made directly in an index.

The S&P 500® Index is a readily available, carefully constructed, market-value-weighted benchmark of common stock performance. Currently, the S&P 500 Composite includes 500 of the largest stocks (in terms of stock market value) in the United States and covers approximately 80% of available market capitalization.

Dividend-focused strategies may underperform strategies that do not limit their investment to dividend-paying stocks. Stocks held strategy may reduce or stop paying dividends, affecting the strategy’s ability to generate income.

Dividend Growing, No-Change-in-Dividend, and Dividend Cutting: Each dividend-paying stock is further classified into one of the three categories based on changes to their dividend policy over the previous 12 months. Dividend Growers and Initiators include stocks that increased their dividend anytime in the last 12 months. Once an increase occurs, it remains classified as a grower for 12 months or until another change in dividend policy. No-Change stocks are those that maintained their existing indicated annual dividend for the last 12 months (i.e., companies that have a static, non-zero dividend). Dividend Cutters and Eliminators are companies that have lowered or eliminated their dividend anytime in the last 12 months. Once a decrease occurs, it remains classified as a cutter for 12 months or until another change in dividend policy. (Source: Ned Davis Research).

Technical Terms: Dividend Risk: Dividend yield is one component of performance and should not be the only consideration for investment. Dividends are not guaranteed and will fluctuate. This report should not be regarded by the recipients as a substitute for the exercise of their own judgment. It is important to review your investment objectives, risk tolerance and liquidity needs before choosing an investment style or manager. Dividend Yield: a financial ratio that measures the annual value of dividends received relative to the market value per share of a security. In other words, the dividend yield formula calculates the percentage of a company’s market price of a share that is paid to shareholders in the form of dividends. The federal funds rate is a cornerstone of U.S. monetary policy and a key driver of economic activity. It refers to the target interest rate range set by the Federal Open Market Committee (FOMC), the policymaking body of the Federal Reserve System.(Technical definitions are sourced from Corporate Finance Institute and Investopedia.)

The Chartered Financial Analyst® (CFA) charter is a graduate-level investment credential awarded by CFA Institute — the largest global association of investment professionals. To earn the CFA charter, candidates must: 1) pass three sequential, six-hour examinations; 2) have at least four years of qualified professional investment experience; 3) join CFA Institute as members; and 4) commit to abide by, and annually reaffirm, their adherence to the CFA Institute Code of Ethics and Standards of Professional Conduct.

Since we began publishing The Lead in 2015, our primary purpose has been to communicate our investment philosophy and process as an investment advisor in the context of changing markets. In creating portfolios that differ from our benchmarks by focusing on characteristics that have a long term history of attractive relative returns according to Ned Davis Research, the portfolios are different from the benchmarks and as a result there can be periods where results differ including below benchmark performance. Since strategies are oriented toward the long term characteristics, if those characteristics are out of favor over a period of time, the given strategy’s performance could be challenged in terms of relative performance. While Sterling believes active professional investment management that employs a consistent process with a long term orientation and aligned with client interests offers benefits, management fees to support the active approach can be higher than certain alternatives. When hiring an investment manager we believe it is important to monitor the investment risks taken including sector concentrations, portfolio turnover, and the impacts of dividend policy changes.

About the Author


Photo of Charles  Wittmann

Charles Wittmann, CFA®

Co-Portfolio Manager

Charles Wittmann, CFA®, Executive Director, joined SCM in 2014 and has investment experience since 1995. Chip is Co-Portfolio Manager of the Equity Income strategy. Prior to joining SCM, he worked for Thompson Siegel & Walmsley as a portfolio manager and (generalist) analyst. Prior to TS&W, he was a founding portfolio manager and analyst with Shockoe Capital, an equity long/short hedge fund. Chip received his B.A. in Economics from Davidson College and his M.B.A. from Duke University's Fuqua School of Business. He holds the Chartered Financial Analyst® designation and served as President of CFA Society Virginia from 2012-2013.

Related Insights


04.03.2025 • Charles Wittmann, CFA®

The Lead - Resilient Quality

03.28.2025 • James Kerin, CFA®

Introduction to Collateralized Loan Obligations

02.04.2025 • Charles Wittmann, CFA®

The Lead - Looking for More

Scroll Up