Skip Navigation

The Lead - Quality Challenges

01.13.2026

The Lead - Quality Challenges

Tags: Equity, Economic Updates

BofA Investment Strategy Selected Proprietary Indices

(Price Performance as of December 31, 2025)

Our purpose with this publication over the years has been to describe how changing markets may impact investment philosophies and style so that investors could be well informed. During certain periods, market anomalies may be historic in terms of their magnitude and impact on stock price performance, albeit temporary. In prior months we have touched on the magnitude that both risk (beta) and momentum may have exhibited in 2025. We believe the flip side of the coin for these characteristics is typically quality.


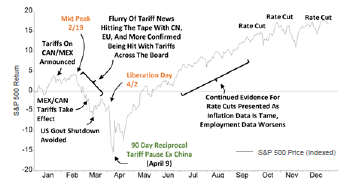
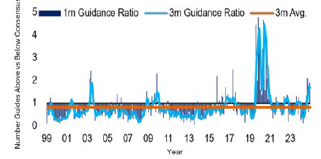
In strong market conditions, such as the post Liberation Day market, falling tariff fears, and the potential for federal funds rate cuts led to a boost in upward earnings expectations to levels not seen since the end of the global financial crisis and Covid-19 (captured in the graphic below).


Large Cap Stocks Trailing 12-Month Relative Returns to Top Quintile of 9-Month Price Momentum

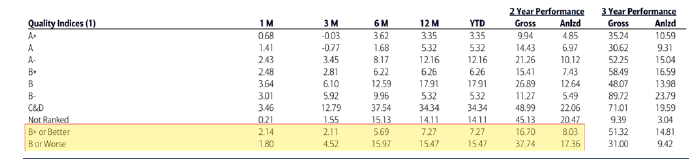
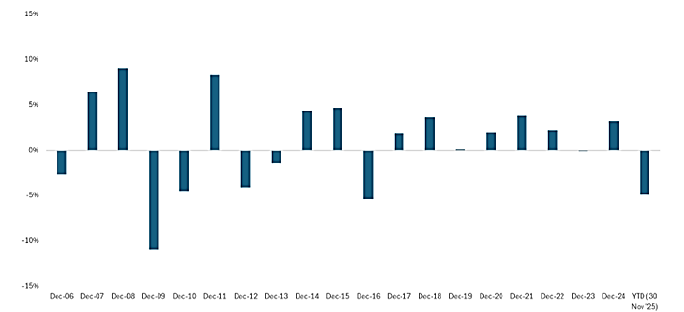
The result is shown in the highlighted portion of the graphic that shows the difference in performance between higher quality and lower quality stocks in the market. In fact, quality was the worst performing characteristic of the ones BofA Global tracked in 2025. The chart below uses S&P’s formula for assigning a quality letter grade to stocks based with higher grades for return on capital, stronger balance sheets, and earnings stability. To place the performance challenges of quality in perspective, we gathered data from BofA Global that combined equally weighted performance of quality and earnings stability trends over the past 20 years.

S&P Guidance Ratio
Annual Performance of Return on Equity and Earnings Stability vs Equal Weight S&P 500®

Moreover, stocks with the highest valuations in the market also appear to have been the best performers. In the chart on this page we show how the most expensive stocks on an earnings basis (Quintile 1 stocks) have been the best performers with the least expensive stocks lagging year-to-date. We believe the bull case, or optimism for a continuation of this trend is that the possibility of additional Federal Reserve rate cuts this month and next year may help propel overall earnings growth to double digit levels in 2026.

Given the dynamics in 2025, we have been finding value in companies with high returns on equity, stable earnings growth, and low debt levels. In our opinion, the environment in 2025 has seemed to provide unique investment opportunities in companies that possess these traits.

As always thank you for your interest and trust managing your investments.

The difference in material performance last year highlighted two contrasting investment characteristics, risk and quality. Risk can be driven by market forces such as unusually strong spikes in earnings revisions which may be fueled by fiscal or monetary stimulus creating an appetite for risk taking, as in stocks for example. We would contrast these bursts with the longer term performance of high returns on capital and earnings growth stability.
It is during short periods of V-shaped bursts of upward earnings expectations that quality styles can experience challenges, although in our view they tend to be temporary as the sugar rush eventually fades.

As always thank you for your interest and trust managing your investments.


Disclosures

Past performance is not indicative of future results. Any type of investing involves risk and there are no guarantees that these methods will be successful. Economic charts are provided for illustrative purposes only. The information provided herein is subject to market conditions and is therefore expected to fluctuate.

The opinions contained in this presentation reflect those of Sterling Capital Management LLC (SCM), are for general information only, and are educational in nature. The opinions expressed are as of the date of publication and are subject to change without notice. These opinions are not meant to be predictions and do not constitute an offer of individual or personalized investment advice. They are not intended as an offer or solicitation with respect to the purchase or sale of any security. This information and these opinions are subject to change without notice. All opinions and information herein have been obtained or derived from sources believed to be reliable. SCM does not assume liability for any loss which may result from the reliance by any person upon such information or opinions.

Investment advisory services are available through SCM (CRD# 135405), an investment adviser registered with the U.S. Securities & Exchange Commission (SEC) and an indirect, wholly-owned subsidiary of Guardian Capital Group Limited. SEC registration does not imply a certain level of skill or training, nor an endorsement by the SEC. SCM manages customized investment portfolios, provides asset allocation analysis, and offers other investment-related services to affluent individuals and businesses.

Sterling Capital does not provide tax or legal advice. You should consult with your individual tax or legal professional before taking any action that may have tax or legal implications.

The securities described are neither a recommendation nor a solicitation. Security information is being obtained from resources the firm believes to be accurate, but no warrant is made as to the accuracy or completeness of the information.

The volatility of an index varies greatly. All indices are unmanaged and investments cannot be made directly in an index.

The BofA Investment Strategy Selected Proprietary Indices offers a range of proprietary indices, primarily through its Global Markets and Merrill Lynch divisions, designed for various investment strategies including multi-asset, volatility control, and thematic equities. These indices are often used as benchmarks for investment products and strategies.

The S&P 500® Index is a readily available, carefully constructed, market-value-weighted benchmark of common stock performance. Currently, the S&P 500 Composite includes 500 of the largest stocks (in terms of stock market value) in the United States and covers approximately 80% of available market capitalization.

The S&P Guidance Ratio is a framework of adjusted financial ratios used in credit analysis to assess a company's financial strength, looking beyond stated numbers by adding or removing debt, earnings, and cash flow items (like leases or non-recurring events) to better reflect true credit risk, with specific criteria for "routine" vs. "situational" adjustments and "clearly trivial" impacts (under 1%) to determine if a company's capacity to absorb losses is sound.

The S&P 500® Equal Weight Index Index is the equal-weight version of the widely-used S&P 500. The index includes the same constituents as the capitalization weighted S&P 500, but each company in the S&P 500 EWI is allocated a fixed weight - or 0.2% of the index total at each quarterly rebalance.


President Donald Trump declared Liberation Day on April 2, 2025, announcing broad tariffs to reduce trade deficits and revive U.S. industry.

Technical Terms: Federal funds rate is the interest rate charged by banks to borrow from each other overnight. The Federal Reserve influences this rate through monetary policy decisions. The global financial crisis (GFC) refers to the period of extreme stress in global financial markets and banking systems between mid 2007 and early 2009. Return on Equity (ROE) is a measure of a company's financial performance. It is calculated by dividing net income by shareholders' equity. Because shareholders' equity is equal to a company’s assets minus its debt, ROE is a way of showing a company's return on net assets. (Technical definitions are sourced from Corporate Finance Institute and Investopedia.)

The Chartered Financial Analyst® (CFA) charter is a graduate-level investment credential awarded by CFA Institute — the largest global association of investment professionals. To earn the CFA charter, candidates must: 1) pass three sequential, six-hour examinations; 2) have at least four years of qualified professional investment experience; 3) join CFA Institute as members; and 4) commit to abide by, and annually reaffirm, their adherence to the CFA Institute Code of Ethics and Standards of Professional Conduct.

Since we began publishing The Lead in 2015, our primary purpose has been to communicate our investment philosophy and process as an investment advisor in the context of changing markets. In creating portfolios that differ from our benchmarks by focusing on characteristics that have a long term history of attractive relative returns according to Ned Davis Research, the portfolios are different from the benchmarks and as a result there can be periods where results differ including below benchmark performance. Since strategies are oriented toward the long term characteristics, if those characteristics are out of favor over a period of time, the given strategy’s performance could be challenged in terms of relative performance. While Sterling believes active professional investment management that employs a consistent process with a long term orientation and aligned with client interests offers benefits, management fees to support the active approach can be higher than certain alternatives. When hiring an investment manager we believe it is important to monitor the investment risks taken including sector concentrations, portfolio turnover, and the impacts of dividend policy changes.

About the Author


Photo of Charles Wittmann

Charles Wittmann, CFA®

Co-Portfolio Manager

Charles Wittmann, CFA®, Executive Director, joined SCM in 2014 and has investment experience since 1995. Chip is Co-Portfolio Manager of the Equity Income strategy. Prior to joining SCM, he worked for Thompson Siegel & Walmsley as a portfolio manager and (generalist) analyst. Prior to TS&W, he was a founding portfolio manager and analyst with Shockoe Capital, an equity long/short hedge fund. Chip received his B.A. in Economics from Davidson College and his M.B.A. from Duke University's Fuqua School of Business. He holds the Chartered Financial Analyst® designation and served as President of CFA Society Virginia from 2012-2013.

Related Insights


12.11.2025 • Charles Wittmann, CFA®

The Lead - More Momentum?

12.09.2025
Gregory Zage, CFA®, Justin Nicholson

The Sterling Capital VAULT: Passive Investing is NOT Static Investing

11.11.2025 • Charles Wittmann, CFA®

The Lead - The Flat Pause

Scroll Up