Skip Navigation

The Lead - Redefining Value

07.02.2025

The Lead - Redefining Value

Tags: Equity, Economic Updates

The 2025 Russell 1000® Value Index Reconstitution Includes Several Growthier Stocks

One might wonder if we are using the appropriate benchmark for the Equity Income strategy since we own a large capitalization software company that is commonly classified in databases as a large cap growth stock. We think this is an appropriate question as professionals in manager research are tasked with assessing if a manager is "true to style.” If they are allocating assets to a value manager, will their performance correlate to the value benchmark? If investment manager returns are different from the benchmark, is it due to skill or that their holdings are not representative of the benchmark against which they are being measured?

Why would several mega-cap stocks that have been classified as 100% growth in the past be classified, even partially, in value? FTSE Russell uses an objective style and methodology that splits the Russell 1000® Index into growth or value based primarily on earnings growth, sales growth, and price-to-book measures (the last reconstitution was June 27, 2025). One constraint is that Russell 1000® Growth and Russell 1000® Value Indexes need to total the core Russell 1000. An example of this challenge is Amazon, which was 3.6% of the Russell 1000 at the time of reconstitution. Instead of assigning a full 3.6% change to the value benchmark, Russell has announced its partial weight is now 2.1% based on its criteria, as seen in the table to the right.

Companies Added to the 2025 Russell 1000 Value

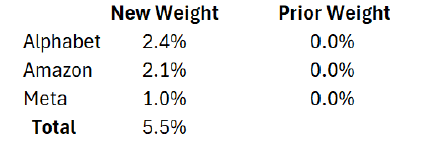
In the table, Russell points to each of these stocks’ improved price-to-book valuations and modestly slower growth characteristics for the reclassification, in addition to the maturation of their businesses given their size. We believe that other dynamics play a role. We feel that the sizeable weights of these mega-cap stocks in the overall index, while keeping the growth and value indexes the same size, achieve the stated desire to minimize turnover. Through partial weights, there may be fewer annual switches of stocks between the growth and value indexes in an effort to minimize the changes investors who want to mimic the benchmarks may need to make when tracking them.

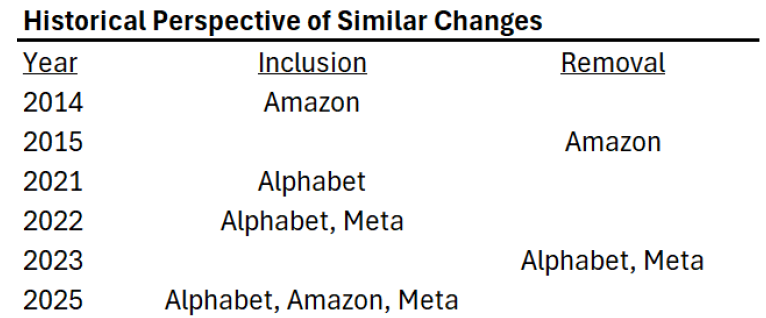
The table at the top of the page showcases a situation that we have seen happen before, notably in 2022 when several notable growth stocks were classified as value for a year. Only twelve months later, those stocks were gone from the index. It was a short-lived visit
“as a value stock” from our perspective.

Russell 1000 Value Sector Weight Changes

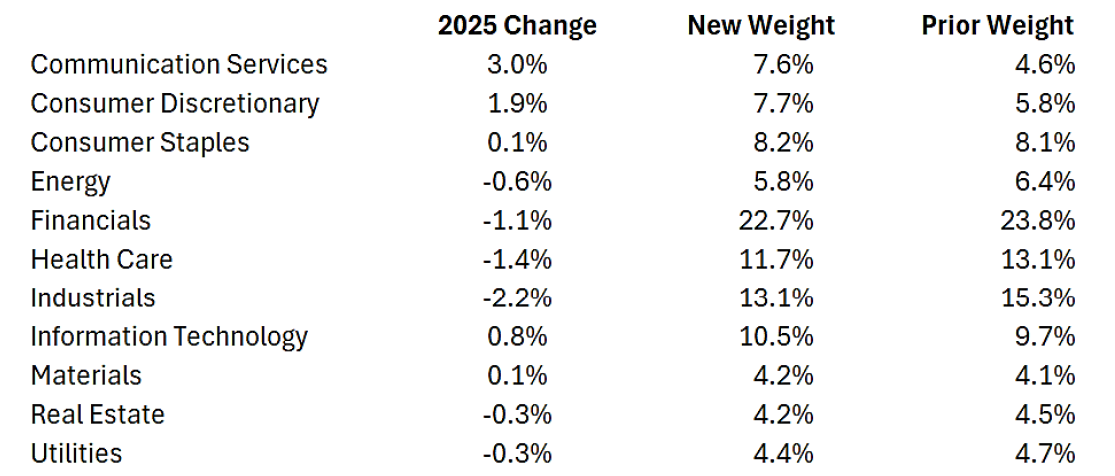
In the meantime, we believe the inclusion of these names may have an impact on the overall complexion of the economic sector weights of the index, notably Communication Services, as seen in the chart above. What is interesting to us is that many times, it is the benchmark making short-term oriented changes, not the manager’s investment philosophy or style. We have held a large cap software stock for over a decade that has been classified differently during our holding period. We kept it because we believe it is consistent with our investment philosophy and mandate over the past decade, while acknowledging there have also been short-term annual entrances and exits by certain stocks in our benchmark. When asked if we plan to change our investments for the changes in the benchmark, the answer is we are aware of the changes, and our focus remains committed to the same process and mandate that has stood for decades.

As always, thank you for your interest and trust managing your investments.


Disclosures

Past performance is not indicative of future results. Any type of investing involves risk and there are no guarantees that these methods will be successful. Economic charts are provided for illustrative purposes only. The information provided herein is subject to market conditions and is therefore expected to fluctuate.

The opinions contained in this presentation reflect those of Sterling Capital Management LLC (SCM), are for general information only, and are educational in nature. The opinions expressed are as of the date of publication and are subject to change without notice. These opinions are not meant to be predictions and do not constitute an offer of individual or personalized investment advice. They are not intended as an offer or solicitation with respect to the purchase or sale of any security. This information and these opinions are subject to change without notice. All opinions and information herein have been obtained or derived from sources believed to be reliable. SCM does not assume liability for any loss which may result from the reliance by any person upon such information or opinions.

Investment advisory services are available through SCM, an investment adviser registered with the U.S. Securities & Exchange Commission and an indirect, wholly-owned subsidiary of Guardian Capital Group Limited. SCM manages customized investment portfolios, provides asset allocation analysis, and offers other investment-related services to affluent individuals and businesses.

Sterling Capital does not provide tax or legal advice. You should consult with your individual tax or legal professional before taking any action that may have tax or legal implications.

The securities described are neither a recommendation nor a solicitation. Security information is being obtained from resources the firm believes to be accurate, but no warrant is made as to the accuracy or completeness of the information.

The volatility of an index varies greatly. All indices are unmanaged and investments cannot be made directly in an index.

The Russell 1000® Growth Index measures the performance of the large-cap growth segment of the U.S. equity universe. It includes those Russell 1000® companies with higher price-to-book ratios and higher forecasted growth values. The Russell 1000® Growth Index is constructed to provide a comprehensive and unbiased barometer for the large-cap growth segment. The index is completely reconstituted annually to ensure new and growing equities are included and that the represented companies continue to reflect growth characteristics.

The Russell 1000® Index measures the performance of the large-cap segment of the U.S. equity universe. It is a subset of the Russell 3000® Index and includes approximately 1,000 of the largest securities based on a combination of their market cap and current index membership. The Russell 1000® represents approximately 92% of the U.S. market. The Russell 1000® Index is constructed to provide a comprehensive and unbiased barometer for the large-cap segment and is completely reconstituted annually to ensure new and growing equities are included.

The Russell 1000® Value Index measures the performance of the large-cap value segment of the U.S. equity universe. It includes those Russell 1000® companies with lower price-to-book ratios and lower expected growth values. The Russell 1000® Value Index is constructed to provide a comprehensive and unbiased barometer for the large-cap value segment. The index is completely reconstituted annually to ensure new and growing equities are included and that the represented companies continue to reflect value characteristics.

Dividend-focused strategies may underperform strategies that do not limit their investment to dividend-paying stocks. Stocks held strategy may reduce or stop paying dividends, affecting the strategy’s ability to generate income.

Technical Terms: FTSE Russell is a global index leader and provider of benchmarks, data, and analytics for the investment community, owned by the London Stock Exchange Group (LSEG). The Price-to-Book (P/B) ratio is a financial metric that compares a company's market capitalization to its book value of equity, essentially telling investors how much they are paying for each dollar of a company's net assets. It's calculated by dividing the company's stock price by its book value per share. (Technical definitions are sourced from Corporate Finance Institute and Investopedia.)

The Chartered Financial Analyst® (CFA) charter is a graduate-level investment credential awarded by CFA Institute — the largest global association of investment professionals. To earn the CFA charter, candidates must: 1) pass three sequential, six-hour examinations; 2) have at least four years of qualified professional investment experience; 3) join CFA Institute as members; and 4) commit to abide by, and annually reaffirm, their adherence to the CFA Institute Code of Ethics and Standards of Professional Conduct.

Since we began publishing The Lead in 2015, our primary purpose has been to communicate our investment philosophy and process as an investment advisor in the context of changing markets. In creating portfolios that differ from our benchmarks by focusing on characteristics that have a long term history of attractive relative returns according to Ned Davis Research, the portfolios are different from the benchmarks and as a result there can be periods where results differ including below benchmark performance. Since strategies are oriented toward the long term characteristics, if those characteristics are out of favor over a period of time, the given strategy’s performance could be challenged in terms of relative performance. While Sterling believes active professional investment management that employs a consistent process with a long term orientation and aligned with client interests offers benefits, management fees to support the active approach can be higher than certain alternatives. When hiring an investment manager we believe it is important to monitor the investment risks taken including sector concentrations, portfolio turnover, and the impacts of dividend policy changes.

About the Author


Photo of Charles Wittmann

Charles Wittmann, CFA®

Co-Portfolio Manager

Charles Wittmann, CFA®, Executive Director, joined SCM in 2014 and has investment experience since 1995. Chip is Co-Portfolio Manager of the Equity Income strategy. Prior to joining SCM, he worked for Thompson Siegel & Walmsley as a portfolio manager and (generalist) analyst. Prior to TS&W, he was a founding portfolio manager and analyst with Shockoe Capital, an equity long/short hedge fund. Chip received his B.A. in Economics from Davidson College and his M.B.A. from Duke University's Fuqua School of Business. He holds the Chartered Financial Analyst® designation and served as President of CFA Society Virginia from 2012-2013.

Related Insights


06.20.2025 • Andrew Richman, CTFA

Fed Well-Positioned to Wait

06.10.2025 • Charles Wittmann, CFA®

The Lead - Quality on Sale

05.07.2025 • Charles Wittmann, CFA®

The Lead - Follow the Money

04.03.2025 • Charles Wittmann, CFA®

The Lead - Resilient Quality

Scroll Up