(01.02.2003-03.05.2026)

We started this year by analyzing how “quality” stocks experienced historic headwinds last year in terms of relative performance in the market, according to BofA’s strategy team. Last month we discussed how investors define quality, typically those companies with strong balance sheets/stable earnings (see “The Lead” ‒ February 2026) and provided perspectives on this term. In a client meeting this month, the conversation turned beyond defining quality to when quality stocks may experience an improvement in relative performance.
We went back and looked at performance over the last two decades, looking for common themes. We believe the first component that drove improved relative performance in quality stocks was the attractiveness of earnings stability that we discussed last month. It appeared to us that the greater predictability and stability of future earnings growth became more attractive after speculative recovery trades were exhausted. When might we see this occur this cycle?
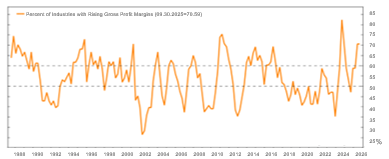
As stock prices tend to follow earnings growth, we think stocks with profits tied to the ebbs and flows of the macro economy or temporary stimulus experience may hit their limit in terms of earnings potential. As their earnings begin to revert back to more historic profitability levels, the stability of earnings that quality stocks provide may offer greater relative value. The chart at the top of this page measures the level of economic surprises over time. As surprises decline from current elevated levels, we believe quality stock performance may improve. The second chart below shows how a broader lift in profit margins has benefitted many industries. Again, looking back, as the percentage of companies with rising margins began to decline, and showed a tendency to favor companies with more consistent earnings, stability, and predictability.
(06.30.1986-09.30.2025)
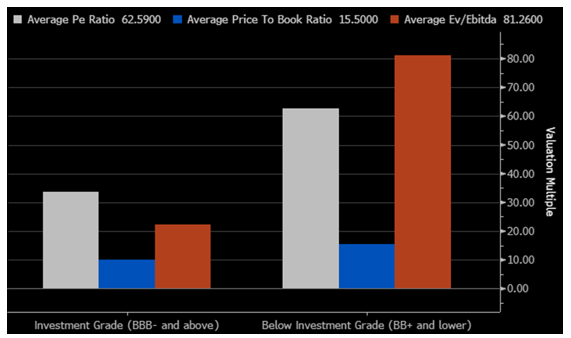
We believe one definition of quality is that, all else being equal, investors may be willing to pay a higher price to acquire the asset. If that definition is correct, the market may appear to be offering quality stocks at a discount. The chart on this page shows the relative value of high- and low-quality stocks based on their debt ratings across a number of valuation measures. Across each assessment shown, in our opinion, quality appears to be on sale.
As always thank you for your interest and trust managing your investments.
About the Author

Charles Wittmann, CFA®, Executive Director, joined SCM in 2014 and has investment experience since 1995. Chip is Co-Portfolio Manager of the Equity Income strategy. Prior to joining SCM, he worked for Thompson Siegel & Walmsley as a portfolio manager and (generalist) analyst. Prior to TS&W, he was a founding portfolio manager and analyst with Shockoe Capital, an equity long/short hedge fund. Chip received his B.A. in Economics from Davidson College and his M.B.A. from Duke University's Fuqua School of Business. He holds the Chartered Financial Analyst® designation and served as President of CFA Society Virginia from 2012-2013.
Related Insights
02.11.2026 • Charles Wittmann, CFA®
01.13.2026 • Charles Wittmann, CFA®
12.11.2025 • Charles Wittmann, CFA®
12.09.2025
Gregory Zage, CFA®, Justin Nicholson
The Sterling Capital VAULT: Passive Investing is NOT Static Investing

