Skip Navigation

The Lead - Stability in a Dynamic Market

02.11.2026

The Lead - Stability in a Dynamic Market

Tags: Equity, Economic Updates

Bloomberg One Year Long/Short Factor Performance

(12.31.2024-12.31.2025)

How does one define “quality?” It is a question that we have sought to answer over the years in terms of a quality-oriented investment process and investing in what we consider “quality” stocks. We believe the most common quantitative measurement tends to be a company’s return on equity and how it stacks up relative to other businesses in the stock market.

Another characteristic that we believe describes “quality” is stability—stability in earnings, earnings growth, and stock price movement in general. Why do entities such as Standard and Poor’s and the rating agencies that use quantitative measurements of quality incorporate stability? For companies exhibiting high profitability, we believe it can be crucial to identify if this profitability is temporary and fleeting or if it is consistent and reliable, demonstrating a durable source of returns on capital. Assessing stability may weed out those companies that could be structurally unsound or subject to adverse changes under stress. In many ways, stability of a company’s balance sheet and predictability of earnings may provide resiliency in market downturns and protect capital.

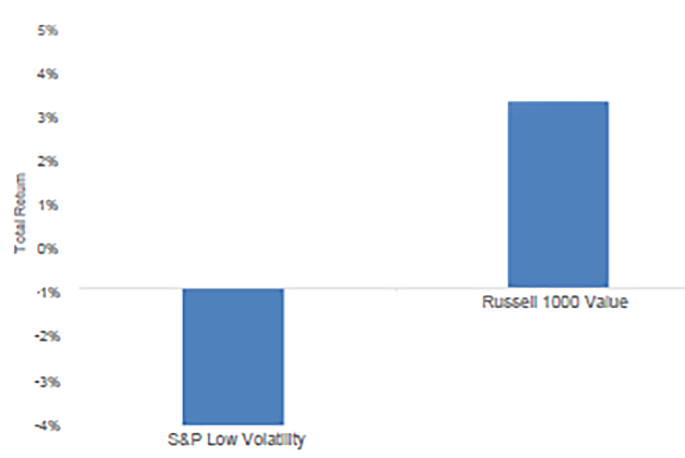
Last year we noted the vigorous year for beta, or risk, in terms of stock performance. We also thought it was a challenging year for stability, notably in the fourth quarter. In the charts on this page, we look at stability from two sources—both measure the market volatility of stocks. The top chart measures 4Q25 performance with just the difference in the top and bottom quintiles of familiar characteristics, with low volatility experiencing stronger results. The chart below shows the absolute return difference between S&P 500 Low Volatility Index against the Russell 1000® Value Index.


4Q25 Total Return Comparison of S&P

(Low Volatility Index to Russell 1000 Value)

EPS/Stability Characteristic – Most Recent Quarter versus Long Term

(Long Term - January 31, 1985 to December 31, 2025)

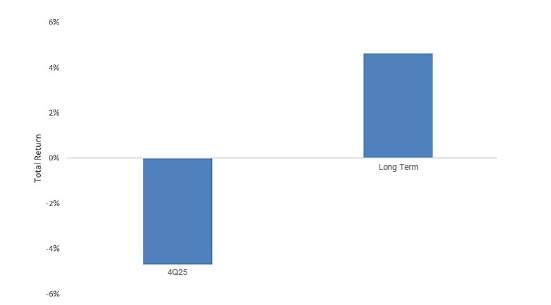
We observed that the nature of market volatility tends to be tightly aligned with the stability of a company’s earnings growth. Companies that historically have exhibited more stable earnings growth and results tend to have less volatile stock market moves. The chart on this page summarizes Ned Davis Research data and shows how the EPS/stability characteristic performed last quarter versus how it has performed over the long term. Despite impressive long-term performance from stocks that have historically demonstrated stable earnings growth, last quarter was a challenge, in our opinion. We believe assessing the performance of characteristics over decades rather than quarters provides perspective on durable characteristics that may add value for the long haul.

As always thank you for your interest and trust managing your investments.


Disclosures

Past performance is not indicative of future results. Any type of investing involves risk and there are no guarantees that these methods will be successful. Economic charts are provided for illustrative purposes only. The information provided herein is subject to market conditions and is therefore expected to fluctuate.

The opinions contained in this presentation reflect those of Sterling Capital Management LLC (SCM), are for general information only, and are educational in nature. The opinions expressed are as of the date of publication and are subject to change without notice. These opinions are not meant to be predictions and do not constitute an offer of individual or personalized investment advice. They are not intended as an offer or solicitation with respect to the purchase or sale of any security. This information and these opinions are subject to change without notice. All opinions and information herein have been obtained or derived from sources believed to be reliable. SCM does not assume liability for any loss which may result from the reliance by any person upon such information or opinions.

Investment advisory services are available through SCM (CRD# 135405), an investment adviser registered with the U.S. Securities & Exchange Commission (SEC) and an indirect, wholly-owned subsidiary of Guardian Capital Group Limited. SEC registration does not imply a certain level of skill or training, nor an endorsement by the SEC. SCM manages customized investment portfolios, provides asset allocation analysis, and offers other investment-related services to affluent individuals and businesses.

Sterling Capital does not provide tax or legal advice. You should consult with your individual tax or legal professional before taking any action that may have tax or legal implications.

The securities described are neither a recommendation nor a solicitation. Security information is being obtained from resources the firm believes to be accurate, but no warrant is made as to the accuracy or completeness of the information.

The volatility of an index varies greatly. All indices are unmanaged and investments cannot be made directly in an index.

The S&P 500® Low Volatility Index measures performance of the 100 least volatile stocks in the S&P 500. The index benchmarks low volatility or low variance strategies for the U.S. stock market.

The Russell 1000 Value Index tracks the performance of the 1,000 largest publicly traded companies in the U.S., representing a significant portion of the overall market capitalization of U.S. equities.

President Donald Trump declared Liberation Day on April 2, 2025, announcing broad tariffs to reduce trade deficits and revive U.S. industry.

Technical Terms: Earnings per share (EPS) is a commonly used measure of a company's profitability. It indicates how much profit each outstanding share of common stock has earned. Generally speaking, the higher a company's EPS, the more profitable it is considered to be. Return on Equity (ROE) is a measure of a company's financial performance. It is calculated by dividing net income by shareholders' equity. Because shareholders' equity is equal to a company’s assets minus its debt, ROE is a way of showing a company's return on net assets. Dividend yield is a ratio that demonstrates a company's annual dividends relative to its shares' market price. (Technical definitions are sourced from Corporate Finance Institute and Investopedia.)

The Chartered Financial Analyst® (CFA) charter is a graduate-level investment credential awarded by CFA Institute — the largest global association of investment professionals. To earn the CFA charter, candidates must: 1) pass three sequential, six-hour examinations; 2) have at least four years of qualified professional investment experience; 3) join CFA Institute as members; and 4) commit to abide by, and annually reaffirm, their adherence to the CFA Institute Code of Ethics and Standards of Professional Conduct.

Since we began publishing The Lead in 2015, our primary purpose has been to communicate our investment philosophy and process as an investment advisor in the context of changing markets. In creating portfolios that differ from our benchmarks by focusing on characteristics that have a long term history of attractive relative returns according to Ned Davis Research, the portfolios are different from the benchmarks and as a result there can be periods where results differ including below benchmark performance. Since strategies are oriented toward the long term characteristics, if those characteristics are out of favor over a period of time, the given strategy’s performance could be challenged in terms of relative performance. While Sterling believes active professional investment management that employs a consistent process with a long term orientation and aligned with client interests offers benefits, management fees to support the active approach can be higher than certain alternatives. When hiring an investment manager we believe it is important to monitor the investment risks taken including sector concentrations, portfolio turnover, and the impacts of dividend policy changes.

About the Author


Photo of Charles Wittmann

Charles Wittmann, CFA®

Co-Portfolio Manager

Charles Wittmann, CFA®, Executive Director, joined SCM in 2014 and has investment experience since 1995. Chip is Co-Portfolio Manager of the Equity Income strategy. Prior to joining SCM, he worked for Thompson Siegel & Walmsley as a portfolio manager and (generalist) analyst. Prior to TS&W, he was a founding portfolio manager and analyst with Shockoe Capital, an equity long/short hedge fund. Chip received his B.A. in Economics from Davidson College and his M.B.A. from Duke University's Fuqua School of Business. He holds the Chartered Financial Analyst® designation and served as President of CFA Society Virginia from 2012-2013.

Related Insights


01.13.2026 • Charles Wittmann, CFA®

The Lead - Quality Challenges

12.11.2025 • Charles Wittmann, CFA®

The Lead - More Momentum?

12.09.2025
Gregory Zage, CFA®, Justin Nicholson

The Sterling Capital VAULT: Passive Investing is NOT Static Investing

Scroll Up