Skip Navigation

The Lead - Uncommon Risk

08.05.2025

The Lead - Uncommon Risk

Tags: Equity, Economic Updates

Beta Performance is in the 99th Percentile

The term “summer doldrums” originated from a nautical term describing a belt of low pressure around the equator, creating windless conditions where sailing ships were becalmed for days. This summer, the stock market has exhibited anything but “summer doldrums.” The stock market rebound off the “Liberation Day” lows has been robust, in our view, with certain areas of the market rebounding more aggressively than others.

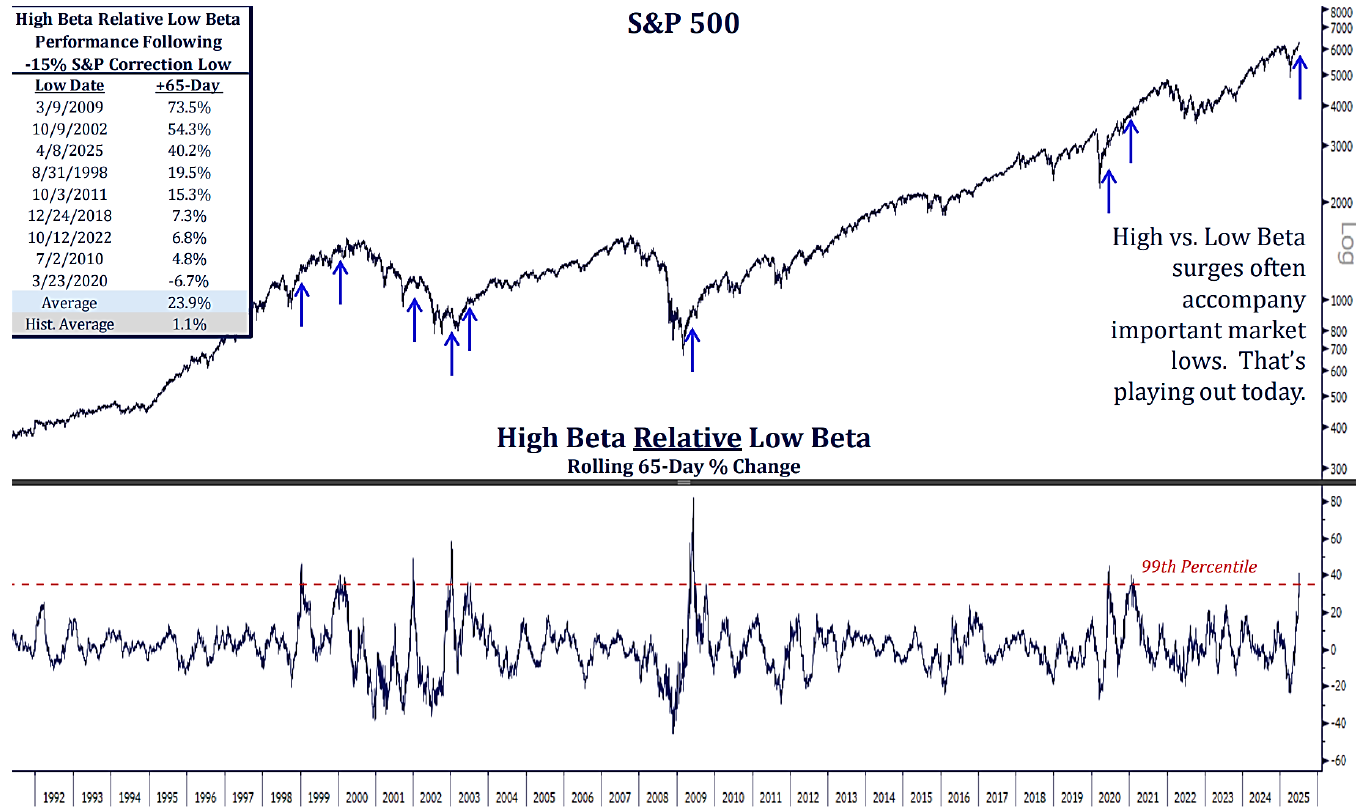
The core purpose of our monthly piece is to share the underlying drivers and trends in the stock market. We want clients to fully understand the characteristics driving the market and the contributors to performance so they can better understand their investments. This summer, we found it difficult to find an area that has experienced greater historic performance than high beta stocks (stocks with higher calculated volatility or price swings relative to the market as a whole). They are generally considered as stocks with greater risk given their price swings. In the chart at the top of the page, we can see that high beta stocks relative to low beta stocks are experiencing a rare divergence in performance. Over the last 25 years, we have only seen this level of divergence in 1% of the observations.

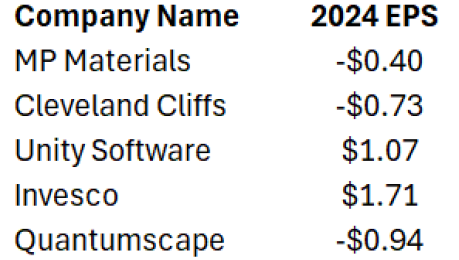
To provide some perspective on why high beta stocks may be considered riskier while linking the risk to fundamentals, we provided a table below with the top five performers in our benchmark this month. The average of this cohort of stocks meets the definition of high beta, and as one can see, the majority have been unprofitable over the past year.

Top Five Absolute Performers in the Russell 1000® Value Index (July 2025)
Beta and Credit Spreads

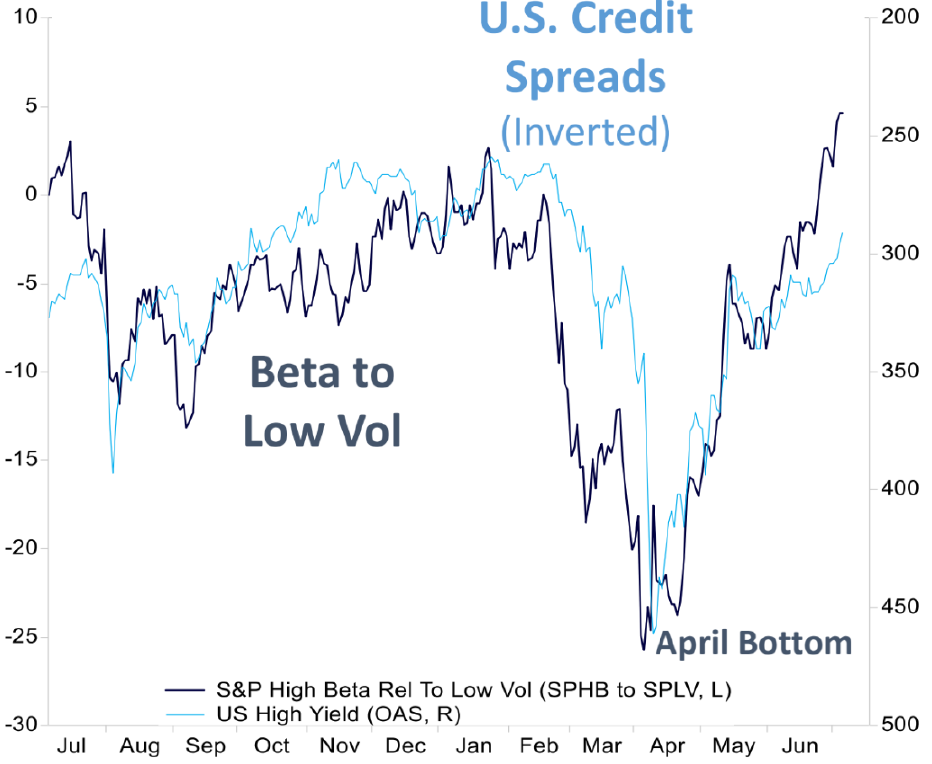
Over the past year, we have seen investors embrace and shed risk in dynamic fashion. The chart above shows that over the past year, high beta performed well in late 2024, largely underperformed in March and April of this year, then rebounded aggressively since April. The chart is also supported by credit spreads, which is another measure of risk. Given where high beta stocks reside today, a return to more balanced performance could bode well for less risky, profitable stocks.

As always, thank you for your interest and trust managing your investments.


Disclosures

Past performance is not indicative of future results. Any type of investing involves risk and there are no guarantees that these methods will be successful. Economic charts are provided for illustrative purposes only. The information provided herein is subject to market conditions and is therefore expected to fluctuate.

The opinions contained in this presentation reflect those of Sterling Capital Management LLC (SCM), are for general information only, and are educational in nature. The opinions expressed are as of the date of publication and are subject to change without notice. These opinions are not meant to be predictions and do not constitute an offer of individual or personalized investment advice. They are not intended as an offer or solicitation with respect to the purchase or sale of any security. This information and these opinions are subject to change without notice. All opinions and information herein have been obtained or derived from sources believed to be reliable. SCM does not assume liability for any loss which may result from the reliance by any person upon such information or opinions.

Investment advisory services are available through SCM, an investment adviser registered with the U.S. Securities & Exchange Commission and an indirect, wholly-owned subsidiary of Guardian Capital Group Limited. SCM manages customized investment portfolios, provides asset allocation analysis, and offers other investment-related services to affluent individuals and businesses.

Sterling Capital does not provide tax or legal advice. You should consult with your individual tax or legal professional before taking any action that may have tax or legal implications.

The securities described are neither a recommendation nor a solicitation. Security information is being obtained from resources the firm believes to be accurate, but no warrant is made as to the accuracy or completeness of the information.

The volatility of an index varies greatly. All indices are unmanaged and investments cannot be made directly in an index.

The Russell 1000® Value Index measures the performance of the large-cap value segment of the U.S. equity universe. It includes those Russell 1000® companies with lower price-to-book ratios and lower expected growth values. The Russell 1000® Value Index is constructed to provide a comprehensive and unbiased barometer for the large-cap value segment. The index is completely reconstituted annually to ensure new and growing equities are included and that the represented companies continue to reflect value characteristics.

The S&P 500® Index is a readily available, carefully constructed, market-value-weighted benchmark of common stock performance. Currently, the S&P 500 Composite includes 500 of the largest stocks (in terms of stock market value) in the United States and covers approximately 80% of available market capitalization.

The Invesco S&P 500® High Beta ETF (Fund) is based on the S&P 500® High Beta Index (Index). The Fund will invest at least 90% of its total assets in the securities that comprise the Index. The Index is compiled, maintained and calculated by Standard & Poor's and consists of the 100 stocks from the S&P 500® Index with the highest sensitivity to market movements, or beta, over the past 12 months.

The Invesco S&P 500® Low Volatility ETF (Fund) is based on the S&P 500® Low Volatility Index (Index). The Fund will invest at least 90% of its total assets in the securities that comprise the Index. The Index is compiled, maintained and calculated by Standard & Poor's and consists of the 100 securities from the S&P 500® Index with the lowest realized volatility over the past 12 months.

Dividend-focused strategies may underperform strategies that do not limit their investment to dividend-paying stocks. Stocks held strategy may reduce or stop paying dividends, affecting the strategy’s ability to generate income.

Technical Terms: Earnings per share (EPS) is a commonly used measure of a company's profitability. It indicates how much profit each outstanding share of common stock has earned. An exchange-traded fund (ETF) pools a group of securities into a fund and can be traded like an individual stock on an exchange. The “Liberation Day” plan includes a 10% tariff on all imports as well as reciprocal tariffs for 60 nations including 34% on China, 32% on Taiwan, 46% on Vietnam, 20% on the European Union, 25% on Canada, and 25% on Mexico. The option-adjusted spread (OAS) is the measurement of the spread of a fixed-income security rate and the risk-free rate of return, which is then adjusted to take into account an embedded option. (Technical definitions are sourced from Corporate Finance Institute and Investopedia.)

The Chartered Financial Analyst® (CFA) charter is a graduate-level investment credential awarded by CFA Institute — the largest global association of investment professionals. To earn the CFA charter, candidates must: 1) pass three sequential, six-hour examinations; 2) have at least four years of qualified professional investment experience; 3) join CFA Institute as members; and 4) commit to abide by, and annually reaffirm, their adherence to the CFA Institute Code of Ethics and Standards of Professional Conduct.

Since we began publishing The Lead in 2015, our primary purpose has been to communicate our investment philosophy and process as an investment advisor in the context of changing markets. In creating portfolios that differ from our benchmarks by focusing on characteristics that have a long term history of attractive relative returns according to Ned Davis Research, the portfolios are different from the benchmarks and as a result there can be periods where results differ including below benchmark performance. Since strategies are oriented toward the long term characteristics, if those characteristics are out of favor over a period of time, the given strategy’s performance could be challenged in terms of relative performance. While Sterling believes active professional investment management that employs a consistent process with a long term orientation and aligned with client interests offers benefits, management fees to support the active approach can be higher than certain alternatives. When hiring an investment manager we believe it is important to monitor the investment risks taken including sector concentrations, portfolio turnover, and the impacts of dividend policy changes.

About the Author


Photo of Charles Wittmann

Charles Wittmann, CFA®

Co-Portfolio Manager

Charles Wittmann, CFA®, Executive Director, joined SCM in 2014 and has investment experience since 1995. Chip is Co-Portfolio Manager of the Equity Income strategy. Prior to joining SCM, he worked for Thompson Siegel & Walmsley as a portfolio manager and (generalist) analyst. Prior to TS&W, he was a founding portfolio manager and analyst with Shockoe Capital, an equity long/short hedge fund. Chip received his B.A. in Economics from Davidson College and his M.B.A. from Duke University's Fuqua School of Business. He holds the Chartered Financial Analyst® designation and served as President of CFA Society Virginia from 2012-2013.

Related Insights


07.02.2025 • Charles Wittmann, CFA®

The Lead - Redefining Value

06.20.2025 • Andrew Richman, CTFA

Fed Well-Positioned to Wait

06.10.2025 • Charles Wittmann, CFA®

The Lead - Quality on Sale

05.07.2025 • Charles Wittmann, CFA®

The Lead - Follow the Money

Scroll Up