Skip Navigation

The Lead - The Flat Pause

11.11.2025

The Lead - The Flat Pause

Tags: Equity, Economic Updates

Nasdaq-100 Index Flat Performance

(12.31.2001 - 12.31.2010)

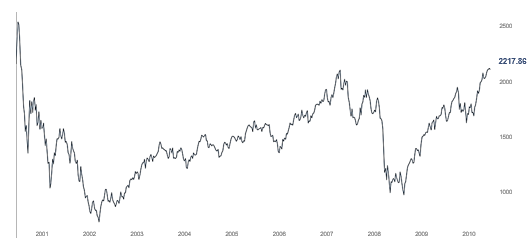
It seems investments that claim to create wealth on an absolute basis may not do as well as many of us might expect. A good example this year is the Nasdaq-100 Index that has seemed to hit new all-time highs in terms of price. Few investors remember that from the turn of the century, and for a decade, the index was flat in terms of price appreciation. What caused the index’s flat performance over that time frame, and what changed to improve its absolute performance? First, in our opinion, the starting valuation for the combined stocks in the index made a difference. Since they were expensive at the start they needed to “earn” their way back into favor. Second, macro-economic shocks such as higher interest rates had an influence raising the cost of capital. In the case of this particular index, we believe overcapacity from overinvestment required time for demand to eventually absorb the tech build out.

A similar dynamic may be at play for stocks themselves, or investment managers.

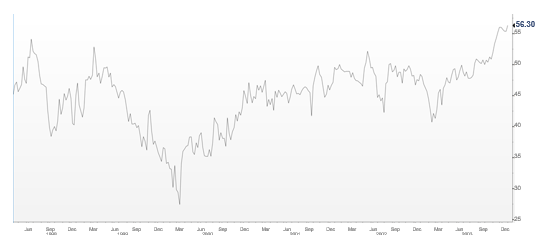
We find a good example that combines both of these properties is Berkshire Hathaway. Berkshire had a prolonged period of flat performance from late 1998 to early 2004. The pause in long-term performance could be ascribed to stylistic challenges such as its value orientation versus growth during the initial portion of that period. While investors may have been frustrated during that time, the disciplined value approach may have helped provide the following trade offs during this period. First, the focus on undervalued predictable businesses meant missing out of the speculative upside from the dot-com bubble, but also avoiding the subsequent bust. Second, during this period the company also maintained a hefty cash balance that was eventually put to work but helped to create depressed returns. The one insurance transaction it did close in 1998 resulted in reserve charges that generated volatility and muted gains through 2004.


Berkshire Hathaway Class B Shares

What can provide an asymmetric edge to hopefully exit a period of flat index or manager performance? We believe in the case of index performance, stocks that yield dividends help augment total returns if price appreciation is limited. In addition, active management of sector exposures may augment returns. In Berkshire’s case, performance improved as investments made during its stock trading flat period began to take hold, and its insurance operations were appreciated by the market.

We are finding value in the segment of the market where high-quality companies that pay growing dividends have generally experienced limited price appreciation despite generating impressive returns on capital. Their dividends augment current returns, while investments that are now in their undervalued franchises have the potential to generate attractive rewards. With many companies at attractive historic valuations, we believe this playbook has the potential to transition flat absolute performance into a resumption of stock price appreciation.

As always thank you for your interest and trust managing your investments.


Disclosures

Past performance is not indicative of future results. Any type of investing involves risk and there are no guarantees that these methods will be successful. Economic charts are provided for illustrative purposes only. The information provided herein is subject to market conditions and is therefore expected to fluctuate.

The opinions contained in this presentation reflect those of Sterling Capital Management LLC (SCM), are for general information only, and are educational in nature. The opinions expressed are as of the date of publication and are subject to change without notice. These opinions are not meant to be predictions and do not constitute an offer of individual or personalized investment advice. They are not intended as an offer or solicitation with respect to the purchase or sale of any security. This information and these opinions are subject to change without notice. All opinions and information herein have been obtained or derived from sources believed to be reliable. SCM does not assume liability for any loss which may result from the reliance by any person upon such information or opinions.

Investment advisory services are available through SCM (CRD# 135405), an investment adviser registered with the U.S. Securities & Exchange Commission (SEC) and an indirect, wholly-owned subsidiary of Guardian Capital Group Limited. SEC registration does not imply a certain level of skill or training, nor an endorsement by the SEC. SCM manages customized investment portfolios, provides asset allocation analysis, and offers other investment-related services to affluent individuals and businesses.

Sterling Capital does not provide tax or legal advice. You should consult with your individual tax or legal professional before taking any action that may have tax or legal implications.

The securities described are neither a recommendation nor a solicitation. Security information is being obtained from resources the firm believes to be accurate, but no warrant is made as to the accuracy or completeness of the information.

The volatility of an index varies greatly. All indices are unmanaged and investments cannot be made directly in an index.

The Nasdaq-100 is a stock market index made up of equity securities issued by 100 of the largest non-financial companies listed on the Nasdaq stock exchange. It is a modified capitalization-weighted index.

Technical Terms: The dot-com bubble was a stock market bubble fueled by highly speculative investments in internet-based businesses during the bull market from 1995 to 2000. It saw the value of equity markets grow dramatically, with the technology-dominated Nasdaq index rising five-fold during that period. Class B shares, a type of common stock, often carry fewer voting rights and lower dividend priority than Class A shares.. (Technical definitions are sourced from Corporate Finance Institute and Investopedia.)

The Chartered Financial Analyst® (CFA) charter is a graduate-level investment credential awarded by CFA Institute — the largest global association of investment professionals. To earn the CFA charter, candidates must: 1) pass three sequential, six-hour examinations; 2) have at least four years of qualified professional investment experience; 3) join CFA Institute as members; and 4) commit to abide by, and annually reaffirm, their adherence to the CFA Institute Code of Ethics and Standards of Professional Conduct.

Since we began publishing The Lead in 2015, our primary purpose has been to communicate our investment philosophy and process as an investment advisor in the context of changing markets. In creating portfolios that differ from our benchmarks by focusing on characteristics that have a long term history of attractive relative returns according to Ned Davis Research, the portfolios are different from the benchmarks and as a result there can be periods where results differ including below benchmark performance. Since strategies are oriented toward the long term characteristics, if those characteristics are out of favor over a period of time, the given strategy’s performance could be challenged in terms of relative performance. While Sterling believes active professional investment management that employs a consistent process with a long term orientation and aligned with client interests offers benefits, management fees to support the active approach can be higher than certain alternatives. When hiring an investment manager we believe it is important to monitor the investment risks taken including sector concentrations, portfolio turnover, and the impacts of dividend policy changes.

About the Author


Photo of Charles Wittmann

Charles Wittmann, CFA®

Co-Portfolio Manager

Charles Wittmann, CFA®, Executive Director, joined SCM in 2014 and has investment experience since 1995. Chip is Co-Portfolio Manager of the Equity Income strategy. Prior to joining SCM, he worked for Thompson Siegel & Walmsley as a portfolio manager and (generalist) analyst. Prior to TS&W, he was a founding portfolio manager and analyst with Shockoe Capital, an equity long/short hedge fund. Chip received his B.A. in Economics from Davidson College and his M.B.A. from Duke University's Fuqua School of Business. He holds the Chartered Financial Analyst® designation and served as President of CFA Society Virginia from 2012-2013.

Related Insights


10.23.2025 • Charles Wittmann, CFA®

The Lead - Thawing in Housing?

10.03.2025 • Michael McVicker

Municipal Bonds: Tax Free, with Exceptions

Scroll Up