Skip Navigation

The Lead - Revisionist History

04.13.2026

The Lead - Revisionist History

Tags: Equity, Economic Updates

Large Capitalization Stocks

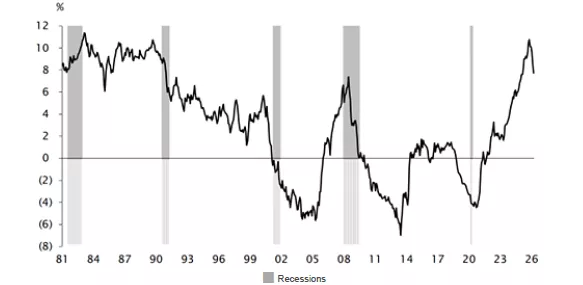
The Relative Returns of the Top Quintile of Earnings Revisions Monthly Data Compounded to Annual Periods — Trailing Five-Year Averages 1981 to Mid-March 2026

As we are in the midst of college basketball teams striving to win and move onto the next round of the NCAA tournament, we’d like to take a look at what has been winning in the market since March of last year. As we shared a year ago, we believe that momentum has been a driving force not only through March of last year, but through the past twelve months. We’ve noted that momentum can consist of price momentum, where stocks that are rising in price may continue to do so into the future. Many times price momentum is coupled with earnings momentum, where stocks that report earnings surprises above Wall Street analysts’ expectations could continue to do so quarter after quarter.


This month Empirical Research Partners provided additional data around this notable period for the performance of earnings revisions, coupled with their observation that recent price momentum has been the strongest in seven decades. There are two important observations from this information that may impact clients’ understanding of their investments.


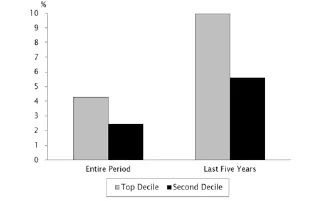
First, their data shows that the 2020’s have seen the strongest performance for earnings revisions since the 1980’s. As the chart at the top of the page shows, since 2020, the top 20% of large capitalization stocks with upward revisions have driven relative performance. The second chart on this page puts the performance over the last five years in perspective, going back even further to 1976.

Large Capitalization Stocks

The Relative Returns of the Top Two Deciles of Earnings Revisions — Monthly Data Compounded to Annual Periods 1976 to Mid-March 2026

Large Capitalization Stocks Share of Stocks with Upward Earnings Revisions 1977 to Mid-March 2026

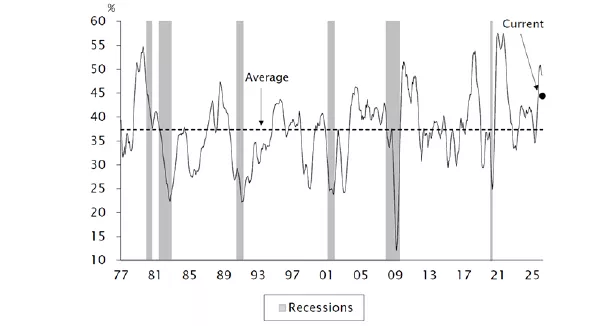
The chart above shows that the percentage of stocks experiencing upward earnings revisions has been more positive than in the past, both during the recovery from the Pandemic and from the recent artificial intelligence capital investment spike in 2025. Our observation is that the strong performance of earnings revisions has been reflected in higher valuations for these securities that historically exhibited more stable and consistent earnings patterns.


As always thank you for your interest and trust managing your investments.


Disclosures

Past performance is not indicative of future results. Any type of investing involves risk and there are no guarantees that these methods will be successful. Economic charts are provided for illustrative purposes only. The information provided herein is subject to market conditions and is therefore expected to fluctuate.

The opinions contained in this presentation reflect those of Sterling Capital Management LLC (SCM), are for general information only, and are educational in nature. The opinions expressed are as of the date of publication and are subject to change without notice. These opinions are not meant to be predictions and do not constitute an offer of individual or personalized investment advice. They are not intended as an offer or solicitation with respect to the purchase or sale of any security. This information and these opinions are subject to change without notice. All opinions and information herein have been obtained or derived from sources believed to be reliable. SCM does not assume liability for any loss which may result from the reliance by any person upon such information or opinions.

Investment advisory services are available through SCM (CRD# 135405), an investment adviser registered with the U.S. Securities & Exchange Commission (SEC) and an indirect, wholly-owned subsidiary of Desjardins Global Asset Management Inc., which is part of the Desjardins Group. SEC registration does not imply a certain level of skill or training, nor an endorsement by the SEC. SCM manages customized investment portfolios, provides asset allocation analysis, and offers other investment-related services to affluent individuals and businesses.

Sterling Capital does not provide tax or legal advice. You should consult with your individual tax or legal professional before taking any action that may have tax or legal implications.

The securities described are neither a recommendation nor a solicitation. Security information is being obtained from resources the firm believes to be accurate, but no warrant is made as to the accuracy or completeness of the information.

The volatility of an index varies greatly. All indices are unmanaged and investments cannot be made directly in an index.

The Chartered Financial Analyst® (CFA) charter is a graduate-level investment credential awarded by CFA Institute — the largest global association of investment professionals. To earn the CFA charter, candidates must: 1) pass three sequential, six-hour examinations; 2) have at least four years of qualified professional investment experience; 3) join CFA Institute as members; and 4) commit to abide by, and annually reaffirm, their adherence to the CFA Institute Code of Ethics and Standards of Professional Conduct.

Since we began publishing The Lead in 2015, our primary purpose has been to communicate our investment philosophy and process as an investment advisor in the context of changing markets. In creating portfolios that differ from our benchmarks by focusing on characteristics that have a long term history of attractive relative returns according to Ned Davis Research, the portfolios are different from the benchmarks and as a result there can be periods where results differ including below benchmark performance. Since strategies are oriented toward the long term characteristics, if those characteristics are out of favor over a period of time, the given strategy’s performance could be challenged in terms of relative performance. While Sterling believes active professional investment management that employs a consistent process with a long term orientation and aligned with client interests offers benefits, management fees to support the active approach can be higher than certain alternatives. When hiring an investment manager we believe it is important to monitor the investment risks taken including sector concentrations, portfolio turnover, and the impacts of dividend policy changes.

About the Author


Photo of Charles Wittmann

Charles Wittmann, CFA®

Co-Portfolio Manager

Charles Wittmann, CFA®, Executive Director, joined SCM in 2014 and has investment experience since 1995. Chip is Co-Portfolio Manager of the Equity Income strategy. Prior to joining SCM, he worked for Thompson Siegel & Walmsley as a portfolio manager and (generalist) analyst. Prior to TS&W, he was a founding portfolio manager and analyst with Shockoe Capital, an equity long/short hedge fund. Chip received his B.A. in Economics from Davidson College and his M.B.A. from Duke University's Fuqua School of Business. He holds the Chartered Financial Analyst® designation and served as President of CFA Society Virginia from 2012-2013.

Related Insights


03.11.2026 • Charles Wittmann, CFA®

The Lead - Signposts for Quality Improvement

02.11.2026 • Charles Wittmann, CFA®

The Lead - Stability in a Dynamic Market

01.13.2026 • Charles Wittmann, CFA®

The Lead - Quality Challenges

12.11.2025 • Charles Wittmann, CFA®

The Lead - More Momentum?

Scroll Up