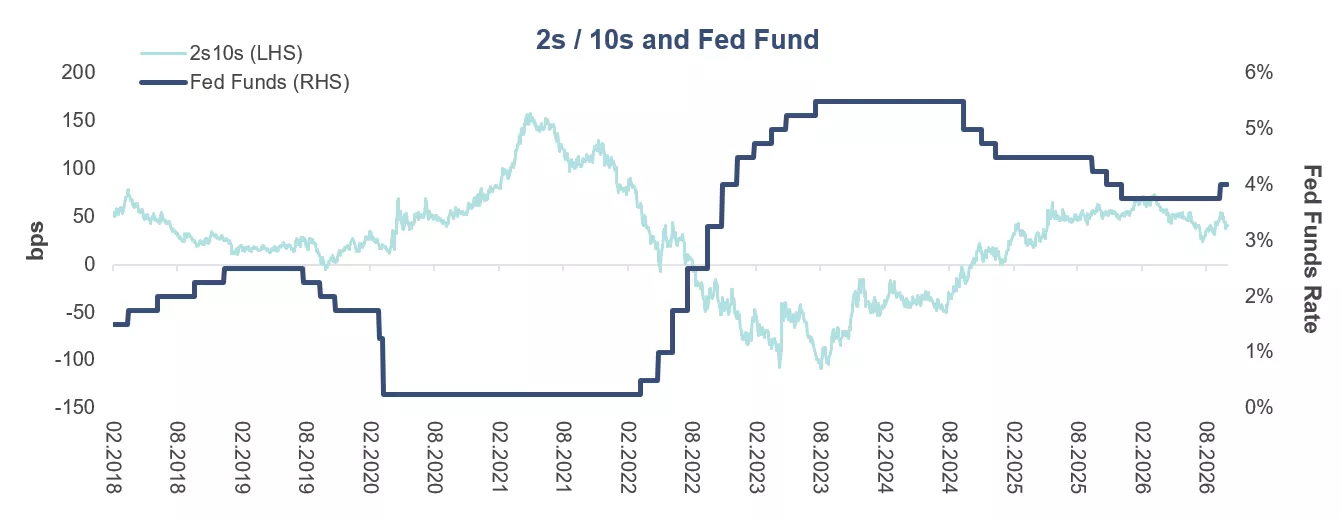
Treasury rates continue to command significant attention on our desk and broadly across the financial community, but their implications for the banking sector are often underappreciated. Below is a chart of the 2s10s and federal funds rate (upper bound) going back to 2018. During 2020-2021 we experienced zero interest rate monetary policy due to COVID-19 and its related lockdowns. Although the yield curve steepened as economic activity recovered, bank net interest margins (NIMs) remained depressed by low asset yields, weak loan demand and excess liquidity from pandemic relief. In this instance, a steeper yield curve did not drive an improvement in bank NIMs.
As the recovery continued, banks contended with a volatile and hard-to-predict environment. In 2022-2023, the Federal Reserve (Fed) enacted rate increases to combat inflation, which flattened the 2s10s curve and subsequently led to a positive repricing of asset yields (loans and securities on balance sheet) with deposit betas starting to creep higher. Floating-rate loans repriced quickly, while fixed-rate loans and securities benefited gradually through maturities, reinvestment and hedges. Deposit betas are a way to measure how reactive banks are in raising or lowering deposit rates in response to a change in market rates or Fed actions. At an assumed marginal deposit beta of 50%, a 25-basis point (bps) hike would translate into a 12.5 bps increase in deposit rates. Note that deposit betas are continuously changing, not uniform and depend on the current rate cycle.
In 2023-2024, while the curve remained inverted, deposit competition increased and funding costs caught up with asset yields, pressuring NIMs. During 2024-2025 the curve steepened again as the Fed began cutting rates. Lower deposit costs and continued asset repricing supported an uneven recovery in NIM.
So where does this leave us today? Regional bank NIMs appear relatively stable on average, while money-center NIMs are mixed. Deposit costs remain relatively sticky and the incremental asset repricing benefit remains positive. It is worth noting that in the previous hiking cycle non-interest-bearing deposits reached 28% (2Q21-2Q22) of total deposits, per FDIC. This provided low-cost funding for banks; however, as the Fed began hiking, the stability of these deposits proved weaker than banks assumed. Ultimately, this created funding pressure for some smaller banks and was a contributing factor in the 2023 banking crisis. As of 2Q26, non-interest-bearing deposits are approximately 18%-19% of total deposits.
Looking at the chart below, we see a structural divergence between regional and money center NIMs. This is largely driven by balance sheet composition, funding mix and asset mix. Meanwhile, the 2s10s curve has flattened from ~70 bps at the beginning of the year to ~48 bps as of 10/6/26, with the 2yr outpacing the move in the 10yr. It has recently steepened from ~29 bps in mid-September.
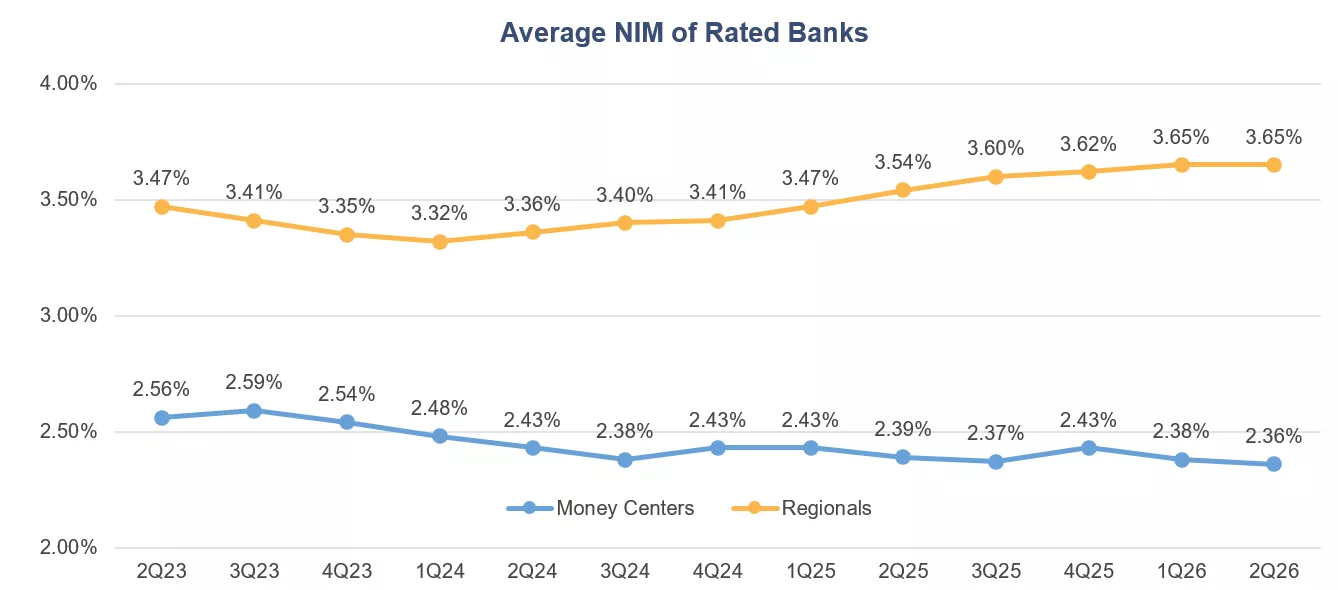
The Fed hiked rates in the September meeting, bringing the fed funds rate to 3.75%-4%. Current market pricing estimates one more hike in 2026. A measured hiking cycle may prove to be beneficial for banks, especially in the context of strong loan growth and a resilient consumer. Higher short-term rates can initially support asset yields at asset-sensitive banks. Deposit betas for total deposits remain contained in the 45%-55% area as reported by management teams in 2Q earnings, asset repricing at higher rates remains a potential positive tailwind, loans and deposits are growing and the regulatory environment seems supportive.
Takeaway: The slope of the curve is an incomplete measure of bank earnings power. Taken together, the path of rates, deposit betas, loan growth, asset sensitivity and asset mix may help determine whether higher rates extend the NIM cycle or bring it to an end.
About the Authors

Gregory Zage, CFA®, Executive Director, joined SCM in 2007 and has investment experience since 2007. Gregory is a Senior Fixed Income Portfolio Manager and Head of Fixed Income Trading. He is currently responsible for all trading activity across SCM's fixed income desks. Previously at SCM, he was responsible for high-grade corporate credit trading and municipal credit trading. Gregory received his B.A. in Economics with a minor in Spanish from Davidson College. He holds the Chartered Financial Analyst® designation.

Dusten Pulido, CFA®, Director, joined SCM in 2021 and has investment experience since 2013. Dusten is a Senior Fixed Income Credit Analyst. Prior to joining SCM, he held analyst positions at Wells Fargo Securities in investment grade fixed income research and debt capital markets. He was also a commercial banking financial analyst at Wells Fargo & Company. Dusten received his B.S. in Business Administration with a major in Finance from the University of Florida. He holds the Chartered Financial Analyst® designation.
Related Insights
09.11.2026 • Charles Wittmann, CFA®
08.31.2026
James Kerin, CFA®, Gregory Zage, CFA®
07.14.2026 • Charles Wittmann, CFA®
06.23.2026
Gregory Zage, CFA®, James Kerin, CFA®