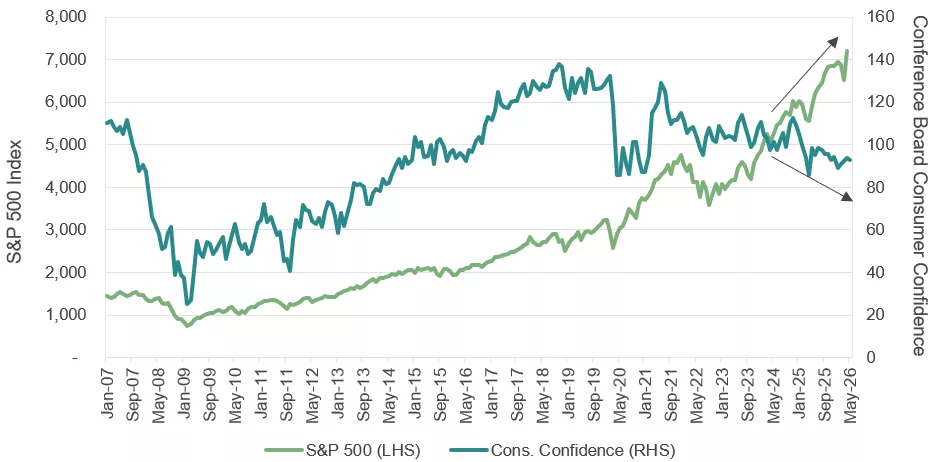
Much ink has been spilled since the COVID-19 pandemic about the “K-shaped economy” or the “K-shaped consumer” to describe the divergence between various groups of consumers (higher-income versus lower-income earners, homeowners versus renters, and so on). Ultimately, the concept is meant to distill a complex economic landscape down to its core drivers. While U.S. equities continue to power ahead to new all-time highs, consumer confidence is at its lowest level since the depths of the pandemic.
Perhaps a better analogy for the state of the consumer is “a rising tide doesn’t lift every boat.” At the aggregate level, we believe U.S. consumption has been stable over the past several years, despite generational inflation, unprecedented trade policy volatility, and now a burgeoning energy supply chain crunch causing immediate pain at the gas pump. While higher-income earners are navigating the current environment, there is clear evidence that lower-income cohorts are taking on water. This ebb and flow of U.S. consumer health comes to life through a traditional financial statement analysis. Let’s dive in.
The Balance Sheet
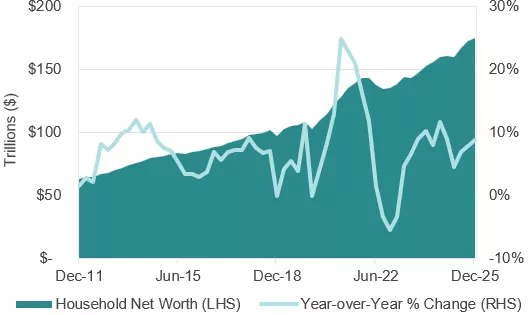
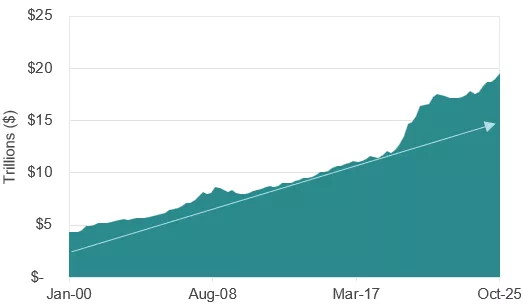
Through the lens of the balance sheet, the U.S. consumer is in a strong position on average compared to recent history. At the highest level, household net worth has grown at an annualized rate of 8.2% since the end of 2019 through the end of 2025 for a cumulative gain of 61%, largely driven by equity market returns and home price gains for homeowners. Meanwhile, households’ liquidity positions (defined by cash, bank deposits, and money market account balances) has soared since the pandemic with a cumulative 44.5% through 4Q25 compared to a total increase in the Consumer Price Index (CPI) of 26.1%.
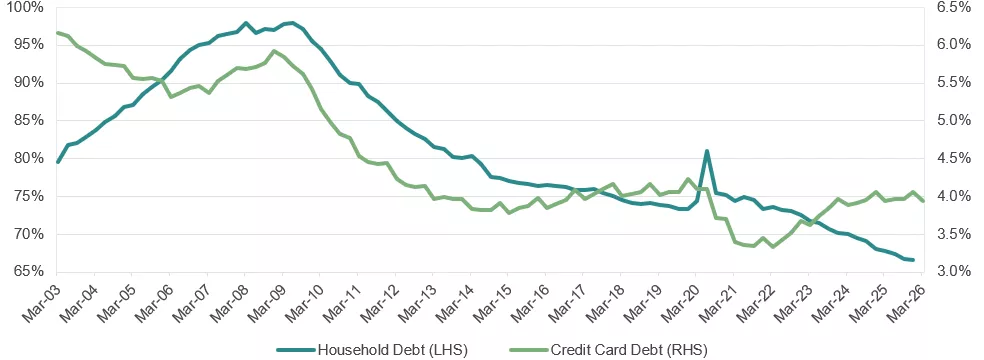
Meanwhile, from a leverage perspective, households appear to manage their debt load well. Many borrowers capitalized on record low interest rates in 2020 and 2021 to refinance debt near all-time low mortgage rates, substantially reducing monthly debt service payments. While the current average 30-year fixed mortgage rate is approximately 6.5%, nearly 70% of borrowers have an outstanding mortgage rate below 5%. Furthermore, despite alarming headlines about credit card debt reaching all-time highs in the past year, when looking at total credit card debt as a percent of nominal gross domestic product (GDP), we find that current levels are consistent with pre-pandemic trends.
The Income Statement
In contrast to the steady improvement shown on the balance sheet, the U.S. consumer’s income statement has followed a volatile and episodic path in recent years. A fiscal stimulus-fueled spending bonanza in 2020 and 2021 was curtailed by an aggressive reset of monetary policy in 2022, a year in which the Federal Reserve (Fed) delivered 425 basis points (bps) of interest rate hikes in an effort to tame inflation. The subsequent and sustained recovery of retail sales data across 2023-2025 surprised many macroeconomists; shouldn’t top-end fed funds at 5.50%, the Fed’s ultimate terminal rate in the hiking cycle, have been more restrictive? Let’s unpack the consumer’s income statement.
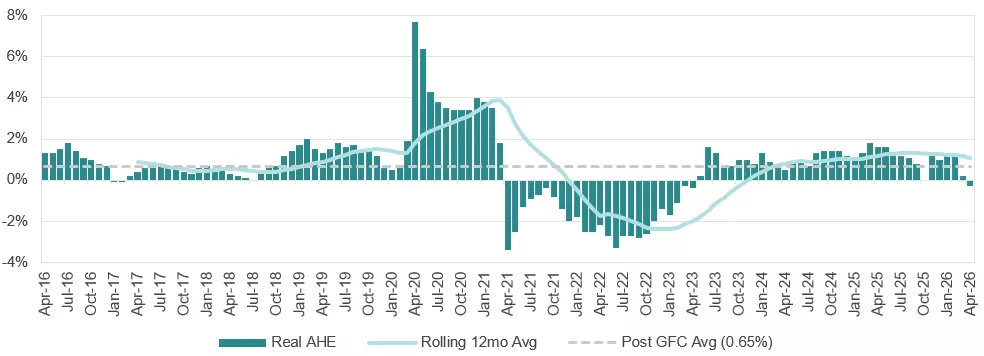
In general, consumer spending is supported by wages and investment income, and real average hourly earnings (AHE) is a solid measure of wage growth in an inflationary environment. While the pandemic skews the metric due to compositional issues (i.e., workers leaving and then re-entering the workforce in 2020 and 2021), it is clear in the chart below that real AHE supported consumption in 2023-2025, making the recent decline pattern troubling, particularly when viewed in combination with the recent softness in real retail sales.
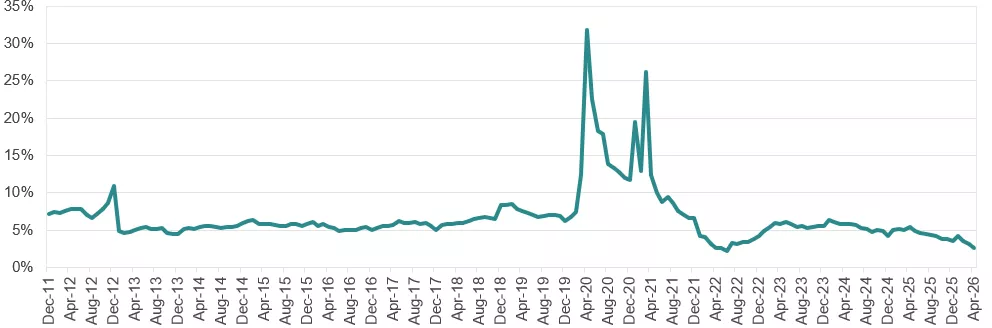
The Federal Reserve Bank of Atlanta’s wage growth tracker below adds useful context, showing a continued disinflationary trend dating back to the peak in mid-2022. As labor supply came back online post-pandemic, wage growth also retreated, in contrast to the pandemic era when workers had unusual bargaining power and many corporations chased talent. Over the last year, a low quits rate and more subdued hiring have created low-hire, low-fire job market conditions that contributed to wage growth stagnation. Perhaps an underappreciated element at play is the significant jumps in large language model (LLM) performance in the beginning of 2026, which may introduce a valid concern that workers in a service-based economy (such as the U.S. economy) could structurally lose wage pricing power. On the flip side, the artificial intelligence (AI) infrastructure buildout itself has created a large demand for workers in skilled trades.
Savings rate data further validates the case for a weakening consumer. The current reading in the chart below, 2.6%, is one of the lowest monthly observations in the entire post-war dataset. A more positive read may be that the savings rate is falling below 3% due to the wealth effect. While the more affluent U.S. consumer cohort may have investments and housing assets to tap, in the context of an ongoing energy price shock and rising credit card delinquency data, the savings rate is a potential cautionary sign.
About the Authors

Gregory Zage, CFA®, Executive Director, joined SCM in 2007 and has investment experience since 2007. Gregory is a Senior Fixed Income Portfolio Manager and Head of Fixed Income Trading. He is currently responsible for all trading activity across SCM's fixed income desks. Previously at SCM, he was responsible for high-grade corporate credit trading and municipal credit trading. Gregory received his B.A. in Economics with a minor in Spanish from Davidson College. He holds the Chartered Financial Analyst® designation.

James Kerin, CFA®, Director, joined SCM in 2020 and has investment experience since 2013. James is a Fixed Income Portfolio Manager on SCM's Fixed Income Team. Prior to joining SCM, he was an associate analyst at Moody’s Investors Service. James received his B.A. from the University of Dallas. He holds the Chartered Financial Analyst® designation.
Related Insights
06.11.2026 • Charles Wittmann, CFA®
05.11.2026 • Charles Wittmann, CFA®
04.13.2026 • Charles Wittmann, CFA®

