Skip Navigation

The Lead - Identifying Opportunities

06.11.2026

The Lead - Identifying Opportunities

Tags: Equity, Economic Updates

Large Capitalization Stocks

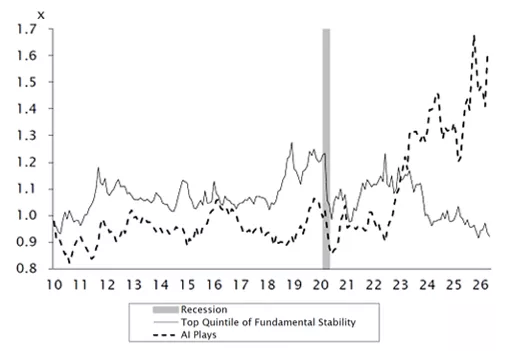
Top Quintile of Fundamental Stability and the AI Plays ― Relative Forward P/E Ratios1 2010-Early May 2026

In understanding the performance of equity strategies this year, we believe it is important to have a sense of their investment style. While AI has been an important theme in the market year-to-date (YTD), fundamental characteristics such as quality, earnings stability, valuation, and earnings surprises (or often called earnings momentum) are also important due to the historic levels of their impact on stock market returns this year, in our opinion.

Empirical Research defines fundamental stability as similar to S&P quality ratings, where higher fundamental stability is measured by higher returns on capital, strong balance sheets, and lower earnings volatility. As seen in the chart at the top of this page, stocks with these characteristics that have historically performed well over long periods of time appear to become cheaper, while their more expensive counterparts seem to get more expensive.

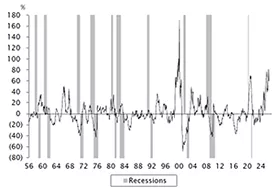
What has also worked well recently, we believe, has been controversial stocks. Empirical defines controversial stocks as those with unexplained price volatility, higher share turnover, and their interpretation of media sentiment. As seen in the chart to the right, stocks with high levels of controversy are appearing to perform at near record levels.

Large Capitalization Stocks

Relative Returns of the Intersection of the Top Quintile of Nine-Month Stock Price Trends and the Highest Quintile of Controversy.1 Monthly Data Compounded to Annual Periods 1956-Early May 2026

Performance of Low and High Volatility S&P 500 stocks in 2026

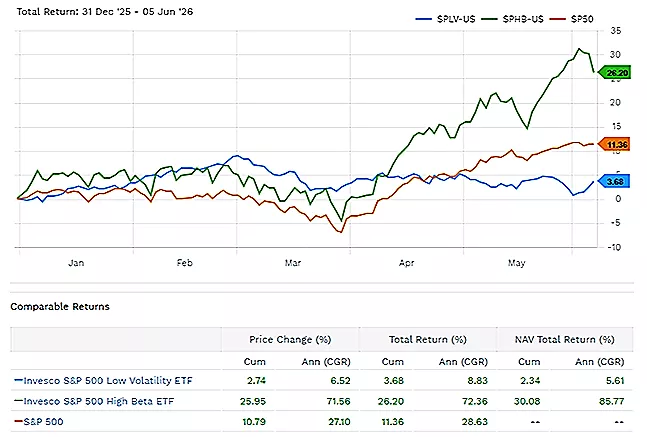
The main contrast between fundamental stability and controversy appears to be captured in the chart above, which shows the YTD divergence between high- and low-volatility stocks measured by their price volatility.

We want to credit Alden Ray on our investment team for this chart discovery as it provides insight into the interaction among investment team members as we seek to identify underlying trends for potential mis-pricings while at the same time, constantly assessing our current holdings and potential opportunities.

As always thank you for your interest and trust managing your investments.


Disclosures

Past performance is not indicative of future results. Any type of investing involves risk and there are no guarantees that these methods will be successful. Economic charts are provided for illustrative purposes only. The information provided herein is subject to market conditions and is therefore expected to fluctuate.

The opinions contained in this presentation reflect those of Sterling Capital Management LLC (SCM), are for general information only, and are educational in nature. The opinions expressed are as of the date of publication and are subject to change without notice. These opinions are not meant to be predictions and do not constitute an offer of individual or personalized investment advice. They are not intended as an offer or solicitation with respect to the purchase or sale of any security. This information and these opinions are subject to change without notice. All opinions and information herein have been obtained or derived from sources believed to be reliable. SCM does not assume liability for any loss which may result from the reliance by any person upon such information or opinions.

Investment advisory services are available through SCM (CRD# 135405), an investment adviser registered with the U.S. Securities & Exchange Commission (SEC) and an indirect, wholly-owned subsidiary of Desjardins Global Asset Management Inc., which is part of the Desjardins Group. SEC registration does not imply a certain level of skill or training, nor an endorsement by the SEC. SCM manages customized investment portfolios, provides asset allocation analysis, and offers other investment-related services to affluent individuals and businesses.

Sterling Capital does not provide tax or legal advice. You should consult with your individual tax or legal professional before taking any action that may have tax or legal implications.

The securities described are neither a recommendation nor a solicitation. Security information is being obtained from resources the firm believes to be accurate, but no warrant is made as to the accuracy or completeness of the information.

The volatility of an index varies greatly. All indices are unmanaged and investments cannot be made directly in an index.

The S&P 500® Index is a stock market index weighted by market capitalization that is made up of 500 of the largest public companies in the U.S.

Technical Terms: Net asset value (NAV) is the difference between a company’s assets and its liabilities calculated at the end of each business day. The compound growth rate (CGR) is the mean annual growth rate over a period longer than one year. It’s an accurate way to calculate and determine returns for individual assets or investment portfolios. (Technical definitions are sourced from Corporate Finance Institute and Investopedia.)

The Chartered Financial Analyst® (CFA) charter is a graduate-level investment credential awarded by CFA Institute — the largest global association of investment professionals. To earn the CFA charter, candidates must: 1) pass three sequential, six-hour examinations; 2) have at least four years of qualified professional investment experience; 3) join CFA Institute as members; and 4) commit to abide by, and annually reaffirm, their adherence to the CFA Institute Code of Ethics and Standards of Professional Conduct.

Since we began publishing The Lead in 2015, our primary purpose has been to communicate our investment philosophy and process as an investment advisor in the context of changing markets. In creating portfolios that differ from our benchmarks by focusing on characteristics that have a long term history of attractive relative returns according to Ned Davis Research, the portfolios are different from the benchmarks and as a result there can be periods where results differ including below benchmark performance. Since strategies are oriented toward the long term characteristics, if those characteristics are out of favor over a period of time, the given strategy’s performance could be challenged in terms of relative performance. While Sterling believes active professional investment management that employs a consistent process with a long term orientation and aligned with client interests offers benefits, management fees to support the active approach can be higher than certain alternatives. When hiring an investment manager we believe it is important to monitor the investment risks taken including sector concentrations, portfolio turnover, and the impacts of dividend policy changes.

About the Author


Photo of Charles Wittmann

Charles Wittmann, CFA®

Co-Portfolio Manager

Charles Wittmann, CFA®, Executive Director, joined SCM in 2014 and has investment experience since 1995. Chip is Co-Portfolio Manager of the Equity Income strategy. Prior to joining SCM, he worked for Thompson Siegel & Walmsley as a portfolio manager and (generalist) analyst. Prior to TS&W, he was a founding portfolio manager and analyst with Shockoe Capital, an equity long/short hedge fund. Chip received his B.A. in Economics from Davidson College and his M.B.A. from Duke University's Fuqua School of Business. He holds the Chartered Financial Analyst® designation and served as President of CFA Society Virginia from 2012-2013.

Related Insights


05.11.2026 • Charles Wittmann, CFA®

The Lead - Sharing the Wealth

04.13.2026 • Charles Wittmann, CFA®

The Lead - Revisionist History

03.11.2026 • Charles Wittmann, CFA®

The Lead - Signposts for Quality Improvement

Scroll Up